Does scale improve the metric?
Within one task, does the measured outcome change with data, model size, or compute?
Since the start of the year, one word keeps coming up in conversations: scaling. Robotics companies have been publishing their own “scaling laws,” and Figure's recent Helix 2.5 result made me want to take stock. What do these curves actually measure? What have they established? And what would it mean if the claimed laws hold?
My primary focus is bimanual manipulation: human-like dual-arm manipulation. Figure is the one exception, because it integrates locomotion, whole-body coordination, and bimanual manipulation into the same task. I focus on this capability because I consider it one of the closest things to a “holy grail” in robotics and embodied intelligence today. Solving complex, general-purpose, reliable bimanual manipulation is what would let robots move beyond moving, imitating, and predicting to useful general-purpose work in the real world. Accordingly, this article does not cover pure locomotion, navigation, motion tracking, or world-model work whose primary objective is future-state or video prediction.
Within one task, does the measured outcome change with data, model size, or compute?
Are several scales tested while training method and evaluation stay as fixed as possible?
Do measured gains carry over to physical-robot tasks? Evaluate new settings, tasks, and bodies separately; the metric need not be whole-task success.
Fit on measured scales and test a larger held-out result. This does not replace robot evaluation.
The forecast is for offline action loss.The one-minute answer
LLM scaling laws describe how validation loss changes with model size, data, and compute, helping teams plan large training runs. Whether robot manipulation exhibits an equally predictable relationship remains unclear. Validation loss alone is not enough: we also need to know whether gains in offline metrics translate into real-robot performance and whether the added investment is worthwhile. I reviewed 19 public results, including work from Generalist, Sunday, Rhoda, and Genesis, as well as open-source and major-lab efforts such as Xiaomi and ABC-130K.
Public results repeatedly show gains from more data, model capacity, or compute within their measured ranges. They still cannot tell us where loss will land at the next scale, how much of that loss gain will become real-robot performance, or whether the investment will pay off.
The five stages are cumulative: define the survey set, identify multi-scale curves, control the main variables, test an out-of-fit forecast, and finally validate robot outcomes on the same model family.
Sixteen enter the main curve collection; three remain indirect evidence about data recipes, cross-embodiment transfer, or offline human motion.
At least one axis—data, model size, or compute—is measured at several scales.
The training method and evaluation stay reasonably fixed, with the main variable and reporting scope clearly identified.
Figure Helix 2.5 fits the first three Index scales and tests the forecast on the 8× offline action-validation loss.
No public result yet completes the chain from scale to a held-out loss forecast and then to robot success on the same model family.
One qualification: 14 of the 16 main projects report robot or deployment-related outcomes somewhere, but none completes the continuous “fit loss → forecast the next scale → validate on robots” test.
Three conclusions follow
More data, model capacity, or compute tends to improve each study's measured metric. Across companies, tasks, metrics, and data sources all change.
Action error, thresholded accuracy, and full-task success have different uses. A good offline fit cannot tell us how many more tasks the next robot will complete.
New objects, contacts, failures, and recoveries may add coverage. Repeated collection in similar settings may add hours without much information.
Background · LLM Scaling
First, scaling laws are primarily used to estimate and predict how loss changes as training scales. For autoregressive models, that loss reflects how well the model fits the data distribution through likelihood. LLM pretraining typically draws on large, heterogeneous corpora that have been filtered, deduplicated, and mixed in deliberate proportions, with Common Crawl as one source of general web data. Most downstream tasks rely on knowledge and linguistic patterns already represented within that distribution. Their benchmark accuracy, however, depends heavily on the evaluation data and scoring protocol; it is shaped more by the underlying distribution than by dataset size or parameter count alone, varies substantially across evaluations, and cannot be inferred from a loss curve.
A language-model scaling law is empirical: under a relatively stable recipe and evaluation distribution, it describes how parameters N, data D, and compute C affect validation loss L. It can help allocate model and data budgets. Under suitable conditions, smaller-model runs and runs with more data can jointly inform a larger-model, larger-data run; holding data roughly fixed can also reveal how loss responds to model size.
L(N,D) ≈ L∞ + ANN−α + ADD−βHere L∞ is the loss floor under a fixed training objective and validation distribution; it remains even as model and data scale approach infinity. Under the same recipe and evaluation distribution, experiments with several model and data scales estimate the shape of loss; compute C limits feasible combinations.
N*(C) and D*(C)For a fixed compute budget, parameters and tokens must grow together; under-allocating either side wastes compute.
Multi-scale training experiments showed that held-out loss could be represented by simple curves, enabling forecasts of larger runs. [25]
This compute-optimal relationship between model size and data is commonly called Chinchilla scaling. A 70B model trained on roughly 1.3T tokens outperformed 280B-parameter Gopher at the same compute, revealing a joint optimum. [26]
The technical report says models trained with the same methodology and up to 10,000× less compute forecast the final run's loss. It also reports a forecast for one code benchmark, not a general conversion from loss to every downstream score. [27]
Autoregressive video models can fit held-out cross-entropy or NLL much like language models. Modern Video DiTs instead often scale a held-out denoising or velocity-regression MSE. This measures a particular score or velocity objective under a fixed parameterization, noise schedule, and validation distribution—not video likelihood or generation quality itself. FID, FVD, human preference, temporal coherence, and physical consistency must therefore be evaluated separately.
From LLMs to robotics
Following the LLM analogy, a scaling law should first describe how validation loss under a fixed objective changes with scale. Robot policies trained with diffusion or flow matching can likewise report denoising or vector-field regression MSE on held-out data; video DiT scaling studies often do the same. The raw values of these objectives, however, are not themselves likelihoods and do not directly measure generation quality or real-robot capability. Robot evaluations therefore often add an action-space validation metric after decoding—sometimes called action-prediction loss—together with closed-loop results from the same checkpoints. Unlike LLMs, robotics still lacks a common pretraining distribution because embodiments, hardware, environments, and collection methods vary widely.
Training data may come from robot teleoperation, human egocentric video, UMI-style handheld capture, simulation, general video, or third-person recordings. All can be counted in hours, but they do not provide the same action information. Defining a shared robot pretraining distribution would mean accurately recording everyone’s behavior worldwide in one go. Under today’s collection methods, we still lack a common pretraining distribution that is both clearly defined and relevant to downstream tasks.
X-axis · data scale
In LLM scaling-law experiments, data volume D is usually measured in training tokens. Standard autoregressive pretraining optimizes next-token prediction. With the tokenizer and data pipeline held fixed, token count therefore provides a relatively stable measure of training volume and, together with model size N, can be used to estimate training compute C. Different tokenizers split the same text differently, but within a consistently defined family of experiments the measurement of D is usually clear. Token count is still only a nominal measure of training volume: it does not reveal how much new information the added data contains. Comparisons across scales depend on keeping the tokenizer, data processing, and data distribution relatively stable within the experiment.
Robot learning faces the same problems of data quality and repetition, while also lacking a common base unit for data volume. Different studies report recorded duration, trajectories, frames, action steps, or action tokens. Each measure is useful, but they do not support direct comparisons of training scale. Recorded duration, for example, helps estimate collection scale and cost, yet the same hour can produce different numbers and forms of training examples under different sampling rates, action representations, chunking schemes, and filtering rules. Even when the number of examples matches, coverage of tasks, settings, objects, and robot embodiments may differ substantially.
LLMs usually count tokens; robotics often uses hours, trajectories, frames, or action steps. These units describe training or collection scale, but none alone reveals how much new information was added.
Data quality, repetition, and coverage determine the value of the same nominal volume. Robotics must also account for tasks, settings, objects, contact states, and embodiments; no common measure exists yet.
One hour may simply repeat a familiar trajectory, or it may add new objects, contact states, failure modes, or recovery paths. Sunday's selected-subset experiment further shows that data content and filtering may matter more than nominal duration.
Lreal = f(N, C, Drobot, Dhuman, Dsim | task, embodiment, environment)Here Lreal denotes action-prediction loss measured on a validation set for the target robot task. The distribution changes with embodiment, task, and environment. A fit obtained in one setting need not carry its coefficients into another.
Real-robot success and task duration—the outcomes we ultimately care about—are even harder to infer from loss. LLM downstream tasks have a similar problem, although most of the knowledge and linguistic patterns they require are already covered by the pretraining distribution. I therefore read every public robot-scaling curve along the same path:
If data volume is the x-axis, hold the model, training method, and evaluation as fixed as possible. Model–data allocation requires both axes inside one experiment; cross-generation product comparisons cannot answer it.
Offline action error may be MSE, L1, or thresholded accuracy, but the action space, loss definition, and validation distribution must remain fixed. A planning curve should also be fit on smaller runs and tested on a larger held-out scale, with forecast error and uncertainty reported.
The same family of checkpoints should then be evaluated on whole-task success, completion, duration, and intervention. A new home, a new task, and a new robot are different distribution shifts and should be reported separately.
Combine new data collection, training compute, robot deployment, and operations, then compare them with gains in success, cycle time, and reduced intervention. Only here can a curve guide the next investment.
Reading order: experiment design and loss first, robot outcomes from the same model family second, cost last. If an earlier link is missing, later numbers cannot simply be attached to it.
The next section places the public curves side by side and asks how far each project gets along this path.
Scaling curves · project by project
Many robotics companies publish scaling curves. The sections below read them one by one: what changes on the x-axis, which distribution defines the loss, and whether the robot results come from the same checkpoints under the same protocol. Metrics and evaluation methods differ across projects, so their slopes are not directly comparable; interactive figures from the original sites are shown here as static captures.
Click a project to expand its figures, measurement details, and evidence limits directly below the row.
| Project | Main scaling variable | Y-axis | Task / setting | Highlights |
|---|---|---|---|---|
| Physical-interaction pretraining data | Offline action error; robot success | Clothing, kitchen, and tabletop manipulation | GEN-0 contains internal sweeps; GEN-1 and GEN-1.5 are new pretraining runs, not points on one data-only curve. | |
| Index human data at 1×–8× | Action-validation loss; whole-task success | Unfamiliar homes, walking plus bimanual work | The only held-out loss forecast; the 3.7% loss change and 9%→56% success result come from separate experiments. | |
| UMI data volume; 2B–10B models | Success on four tasks | Shoe storage, bag packing, table and sofa tidying | Data and model size are swept separately; the full model × data grid is missing. | |
| 1k–1M hours of egocentric human video | MSE / L1 / acc@x; normalized robot performance | Fourteen tabletop, clothing, and household-object tasks | A 1,000× data increase raises acc@0.5 by about seven points; the return on the final 900k hours is unknown. | |
| Web-video pretraining compute | Complete success within 100 seconds | Industrial object manipulation | 57.8%→75.3%; the last two credible intervals overlap. | |
| Pretraining fraction and data selection | Offline loss; robot success | Laundry folding in familiar and unfamiliar homes | A selected 12.5% subset beats a uniform 50% sample. | |
| 10–60 hours of task demonstrations | Seconds per package; barcode rate | One logistics site | A clean single-site learning curve, not evidence of cross-site transfer or a general policy-loss law. | |
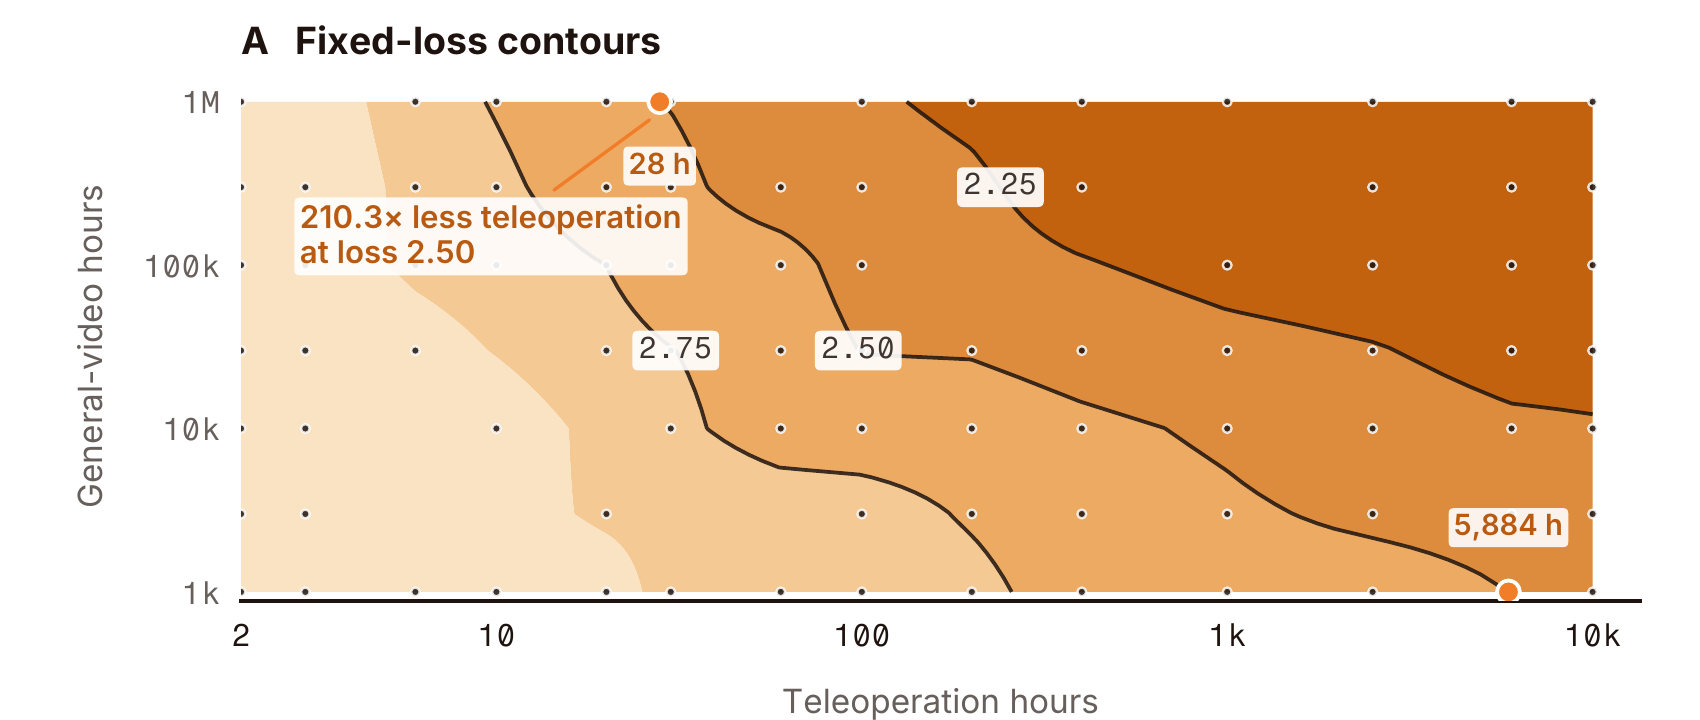
| General video × teleoperation allocation | Offline action-loss contours | Household and tabletop data across 35+ robot systems | The 210.3× exchange rate holds only on one chosen loss contour and is not a robot-data saving guarantee. | |
| 300–30k hours of mixed data | Zero-shot success | 100 household and industrial skills, two embodiments | Both embodiments improve with data; no forecast is tested beyond 30k hours. | |
| 1k–100k hours of mixed pretraining | Cumulative step success | Long-horizon household and tabletop tasks | The metric permits human resets after failures and is not uninterrupted whole-task success. | |
| Robot data, model capacity, and compute | Train/validation metrics; robot task progress | Tabletop bimanual object manipulation | Validation action error tracks robot performance; validation loss is nearly uncorrelated across the tested checkpoints. | |
| Relative model, data, and compute scale | Open-loop loss; simulation completion; robot success | Tabletop and household-object manipulation | All three result families improve with scale, but absolute scales are incomplete and the results do not form one curve. | |
| 1k–20.9k hours of egocentric video | Validation loss; post-training completion | Dexterous-hand manipulation | The offline fit is strong, but no larger held-out scale tests a robot-performance forecast. | |
| 3k–20k hours of multi-embodiment robot data | Task progress and success | 25 tabletop and household tasks, three embodiments | Aggregate performance rises on all three bodies; there is no matched offline loss law. | |
| 2k–20k hours of stereo egocentric video | Action-prediction validation loss | Everyday human hand actions | A clear local loss curve, without a multi-scale robot-success sweep. | |
| Pretraining-task diversity; downstream-data fraction | Simulated task progress | Simulated tabletop and household manipulation | Pretraining improves downstream data efficiency but does not forecast robot success. |
Did you notice that GEN-0, GEN-1, and GEN-1.5 are not one uninterrupted pretraining run?

GEN-0 pretrains on different subsets of roughly 270k hours of physical-interaction data, then uses task-specific data to post-train on 16 task sets. The upper chart focuses on Clothes Handling: more pretraining action trajectories generally reduce next-action prediction error. Its dashed extension to one billion trajectories is a power-law forecast, not a measured point or a robot-success rate.
The lower chart measures robots directly. With the same 5.6 hours of task-specific post-training data, mean success across tasks rises from 0% to 57% as pretraining grows from 0% to 100%. It is not monotonic at every step: success slips from 18% to 15% between the 33% and 50% data settings. The separate 79% bar uses more than 550 hours of task data and does not belong to that controlled sweep.
GEN-1 uses a pool beyond 500k hours and reports 99% success on some simple tasks with about one hour of robot data. Generalist calls it a further scaling of GEN-0's foundation, but also says GEN-1 was trained from scratch with changes to pretraining, post-training, and system design. Its task results can be compared with GEN-0's, but the difference is not a data-only scaling experiment.
GEN-0 · Offline error and robot success

The x-axis counts pretraining action trajectories; the y-axis is post-training next-action prediction error. Roughly 51.2M–363.5M trajectories were measured; one billion is extrapolated.

The left-hand sweep holds task data at 5.6 hours; whiskers show standard error. The 79% bar on the right uses more than 550 hours and is not the same post-training budget.
Figure scales Index human data from 1× to 8× while holding model size and downstream training fixed. Robot-action validation loss falls by roughly 3.7% as read from the figure. The first three runs forecast the 8× run with an error just 0.54% of the loss change across the full range; absolute training hours remain private.
A separate experiment provides the robot result: full-task success across 30 unfamiliar homes rises from 9% without Index pretraining to 56% with it. The study does not evaluate the 1× and 8× models separately, so the offline-loss reduction cannot be converted into a robot-success gain.
Helix 2.5 · Index data scale vs. offline loss

Xiaomi collected more than 100k UMI hours, but its controlled data sweep tests roughly 2.5k, 5k, 10k, and 20k hours. Robot success rises with scale, but this is not a loss law. Holding the 5B model fixed, mean success across four tasks is 53%, 56%, 69%, and 75%; the no-action-pretraining baseline scores 26%.
A separate experiment fixes data at roughly 20k hours and compares 2B, 5B, and 10B models, which score 61%, 75%, and 79%. Each experiment varies one axis; the full three-model by four-data grid is untested.
Across these four tasks, mean success rises 22 percentage points as data grows from roughly 2.5k to 20k hours, versus four points from 5B to 10B at fixed data. This is valuable controlled robot evidence, with success as the y-axis.
Xiaomi-Robotics-1 · Separate data and model sweeps

These projects use different metrics and evaluation rules, so their slopes are not directly comparable. Interactive figures are shown here as static captures, with links back to their sources.
Four data budgets keep architecture, training recipe, and source proportions fixed while human-video pretraining grows. Figure 5 measures MSE and L1 on held-out human data, Figure 7 measures offline error on unseen robot data, and Figure 8 tests post-trained robots. Dyna's acc@x measures the share of predicted actions whose error from the reference action stays within threshold x; actions are generally normalized first, so this is an error threshold.
acc@0.5 gains only about seven percentage points from 1k to 1M hours. The marginal gain looks modest, but this result alone cannot tell us what, if anything, went wrong with the added data. The cross-embodiment offline result in Figure 7 and the robot result in Figure 8 must be read separately.
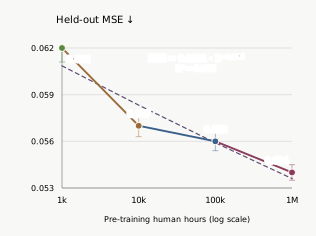
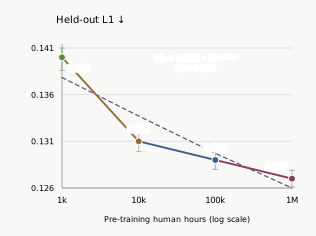
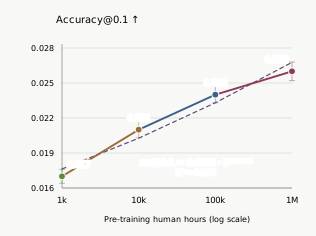
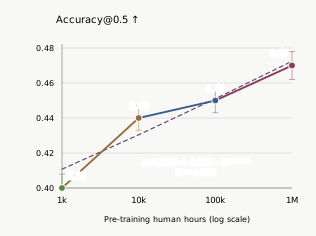
All four metrics improve as data grows: MSE and L1 fall, while thresholded accuracy rises. Accuracy@0.1 improves by 51% relative to its starting value, while MSE falls by 12%. These are relative changes, not percentage-point changes.
Accuracy@0.5 is about 40%, 44%, 45%, and 47%: seven percentage points across 1k to 1M pretraining hours. It requires every predicted action dimension to fall within a normalized error threshold of 0.5; it is neither action completion nor robot task success. MSE, L1, and the stricter accuracy@0.1 also improve, but at different rates.
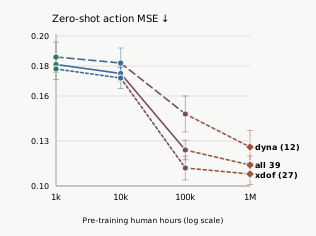
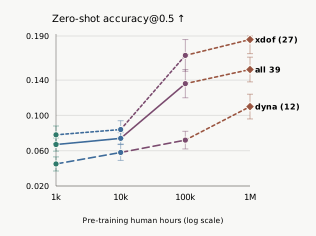
The same checkpoints predict actions on 39 robot tasks unseen in pretraining, with a pronounced gain from 10k to 100k hours. This supports cross-embodiment transfer, but still measures offline prediction.
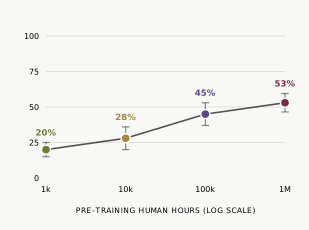
With matched post-training, the 14-task mean normalized score rises 20%, 28%, 45%, 53%. Moving from 100k to 1M hours adds eight points. This score is normalized to each task's attainable maximum; it is not end-to-end success. Most tasks have 10 trials per budget (12 for the language task), so the uncertainty bars matter. The gain is measured, but public data cannot establish whether the extra 900k hours were worth the cost.
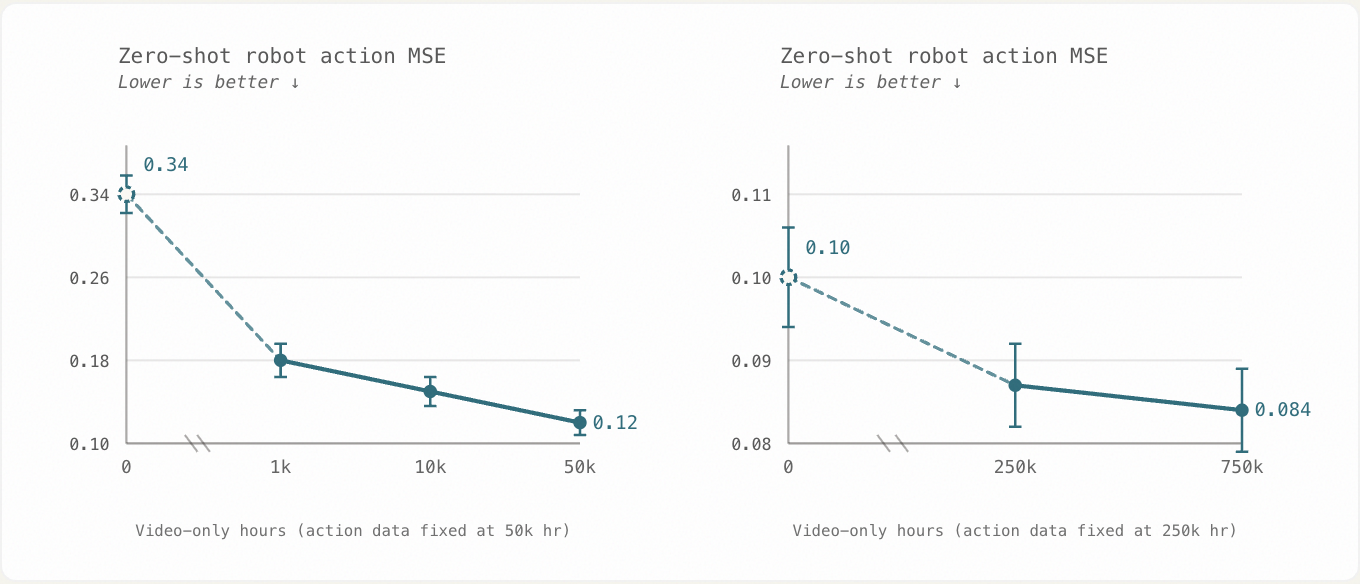
The left panel fixes 50k action-labeled hours; the right fixes 250k. Increasing video-only data lowers offline action error on unseen robot data in both settings. Together with the training-recipe comparison in Figure 10, this shows that the objective and use of video matter alongside hours. Neither experiment isolates the quality of added data, so Figure 5's modest gain cannot establish a diversity shortfall.
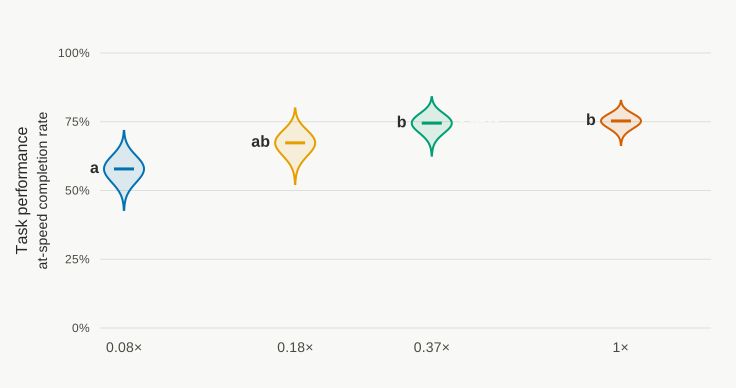
With the M model and downstream demonstrations fixed, only pretraining compute increases. Complete-within-100-seconds success across four budgets is 57.8%, 67.3%, 74.5%, and 75.3%.
The 95% credible intervals for the last two budgets overlap, so these trials do not establish a reliable extra gain from 0.37× to 1×. The original shows interval and trial-count details.
Sunday uses the share of its pretraining corpus as the x-axis, then tests folding success in familiar and unseen settings, the effect of data selection, and the relationship between offline loss and robot success.
These are distinct comparisons: the generalization gap in Figure 1, success rates in Figure 2, and offline loss in Figure 3 are not points on one curve. Absolute pretraining hours are undisclosed.
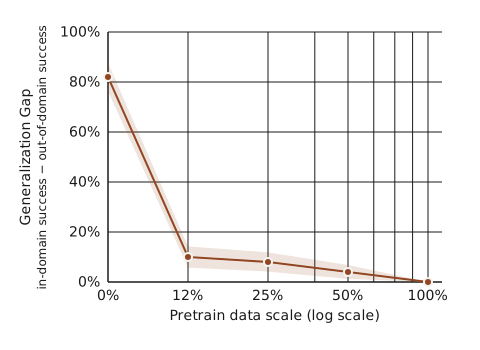
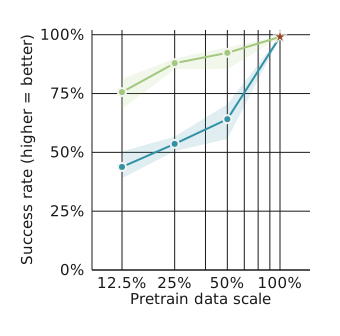
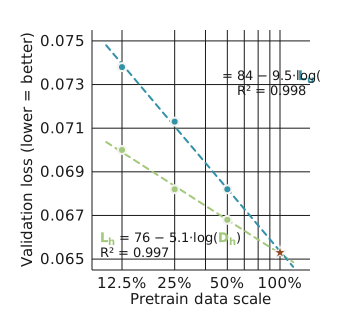
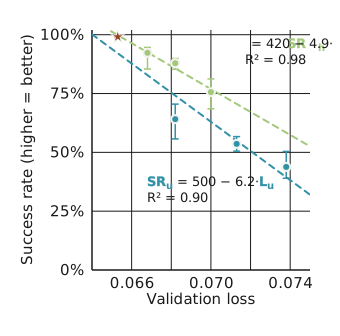
All four figures come from Sunday's ACT-2 report [3]. Original curves, uncertainty bands, and fits are retained; only the canvas margins were expanded to protect axis labels.
Architecture stays fixed while task demonstrations grow from 10 to 60 hours. Labels on the original plot show mean seconds per package falling from 6.34 to 4.31 and barcode success rising from 88.2% to 94.4%.
This is a learning curve for the same logistics site. It does not test transfer to a new site or task.

The paper varies general video and robot teleoperation budgets, then measures offline action loss. Along the 2.50 iso-loss contour, going from 1k to 1M general-video hours moves the required teleoperation budget from roughly 5,884 to 28 hours.
Both hour values are interpolated between measured grid settings, not real-robot success rates. At a 2.75 loss target, the corresponding ratio is only 27.6×; 210.3× is not a universal exchange rate.
Under the same training recipe, data grows through 300, 1,200, 5,000, and 30,000 hours. Mean success across 100 tasks is 17.1%, 22.6%, 27.3%, and 44.1% on G1-OP; G2-90D scores 13.4%, 21.0%, 23.5%, and 31.1%.
Each task has ten zero-shot trials per scale. Both embodiments improve across the tested range. This is relevant real-robot evidence, but its y-axis is success, not offline loss; four points do not forecast success beyond 30,000 hours.

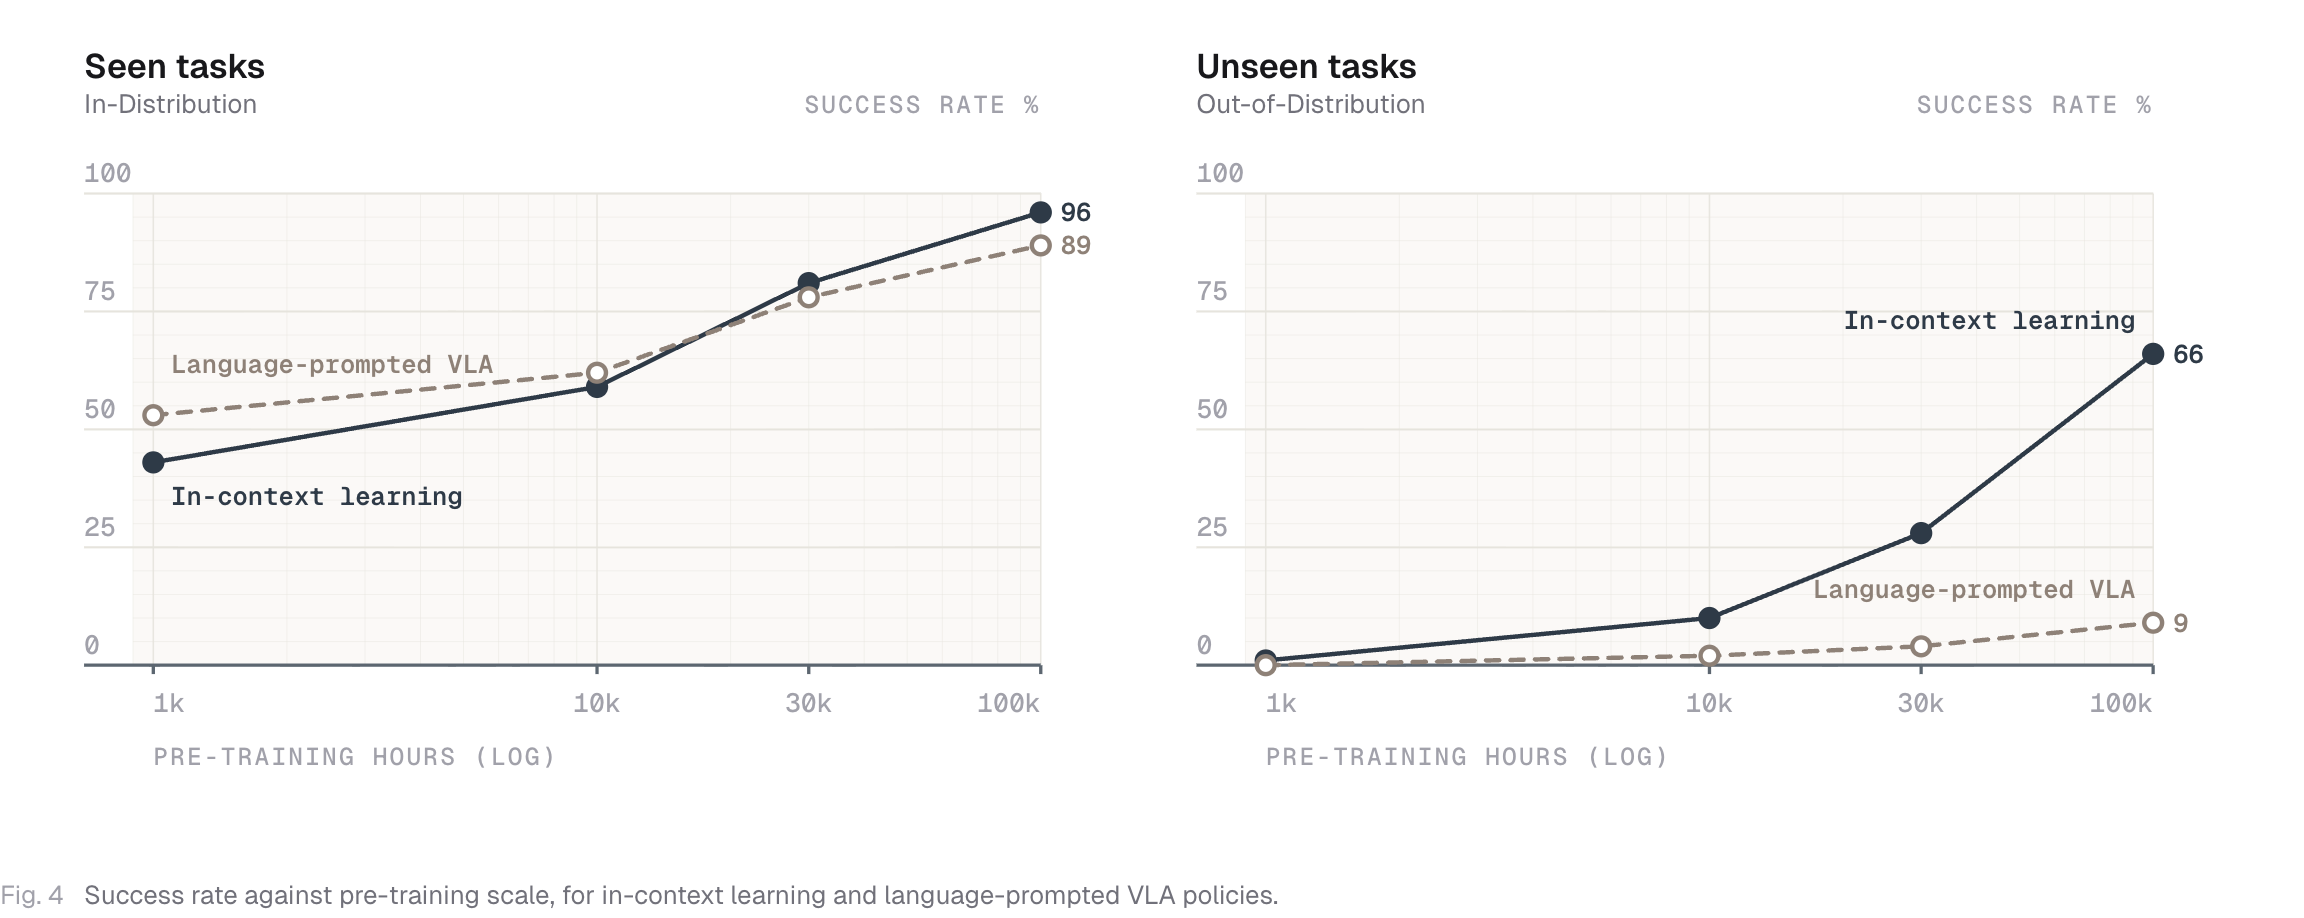
Official Fig. 4 compares demonstration-prompted ICL and language-prompted VLA. At 100k pretraining hours, cumulative step success on unseen tasks is 66% versus 9%.
Humans can intervene after failures on these long tasks; cumulative step success is not uninterrupted whole-task success. This measures task performance, not action loss on a fixed evaluation distribution.
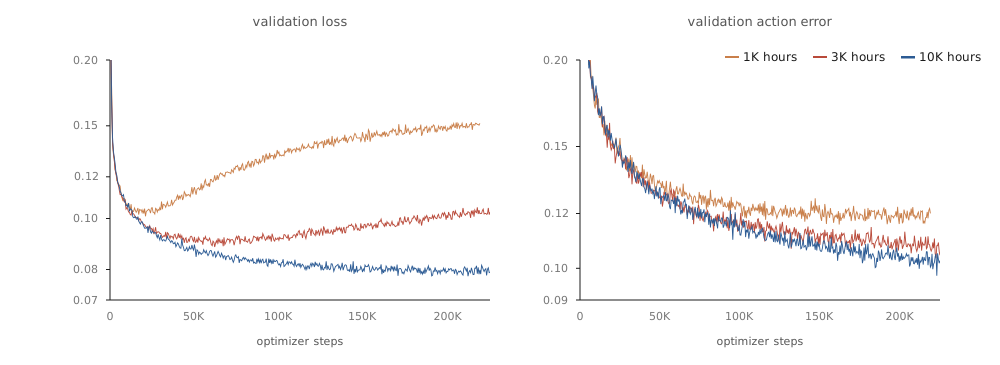
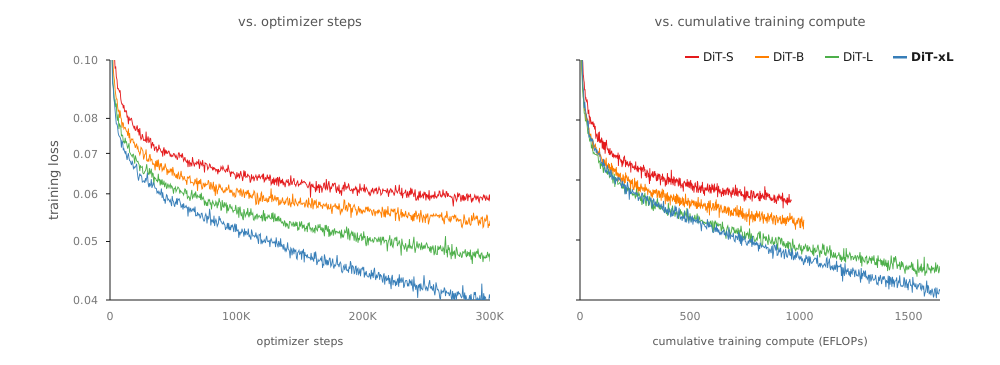
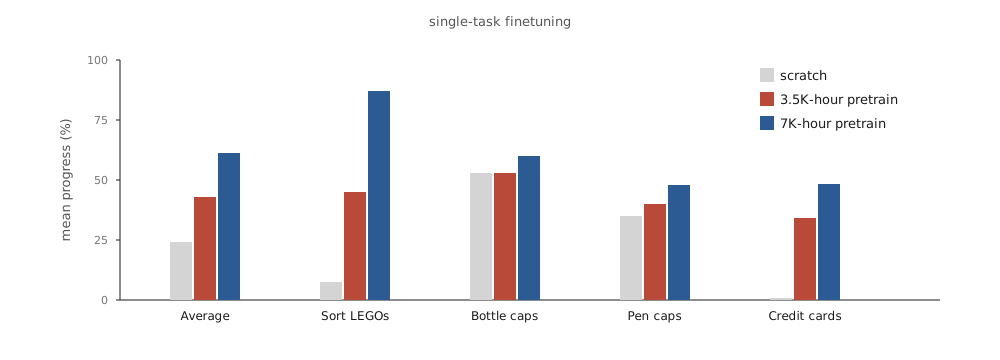
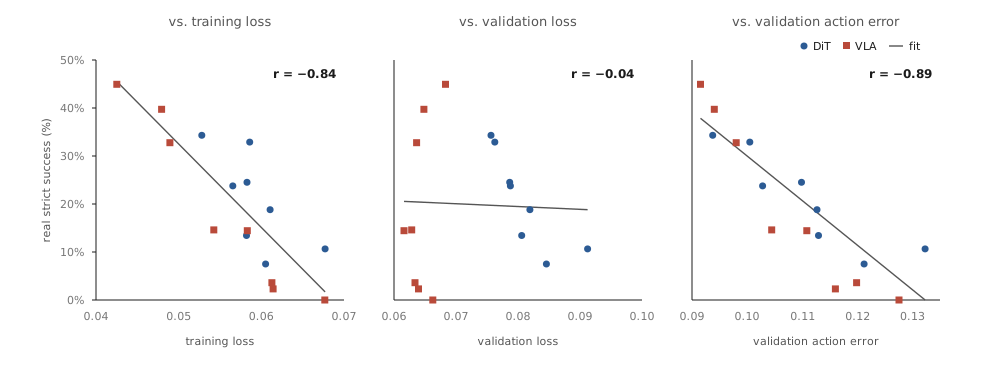
ABC (project / paper) releases 3,553 hours, 134,806 trajectories, and 195 tasks of low-cost bimanual teleoperation data. It separately tests data volume, model capacity, and training compute with DiT and VLA policies. It also compares offline metrics with real-robot evaluations, making it possible to ask which metric improves with more data and whether that improvement carries over to the robot.
Data volume. ABC-DiT is pretrained on 1k, 3k, and 10k hours. Validation loss and validation action error generally fall as data grows, but the 1k run's validation loss rises in the second half of training, suggesting possible overfitting at the smallest scale. In a separate single-task fine-tuning experiment, mean task progress is about 25% when trained from scratch, 42% after roughly 3.5k hours of pretraining, and 61% after roughly 7k hours. The public pool and experimental data must be distinguished: the public release contains about 3.5k hours, while the 10k data run and 7k pretraining run also use unreleased data.
Model capacity and compute. Comparing DiT-S/B/L/xL at fixed training steps or compute budgets, larger action models reach lower training loss. At roughly 300k steps, xL reaches 0.040 versus 0.059 for S. Increasing batch size and training compute also improves real-robot task progress for DiT and VLA. Training loss, compute, and robot progress belong to different experiments and y-axes; they cannot be joined into one curve.
Offline metrics and real robots. Across the 16 checkpoints compared, training loss and validation action error correlate negatively with strict real-robot success (approximately r=−0.84 and −0.89), while the correlation with validation loss is close to zero (approximately r=−0.04). These checkpoints span architectures, batch sizes, and training durations. The result shows that even a metric called “loss” must be read alongside its definition and validation set; an arbitrary offline curve cannot be converted directly into a robot success rate.
Genesis presents pretraining, closed-loop simulation, and low-data real-robot fine-tuning together. All three plots report gains with scale, but they have different axes and answer different questions.
Open-loop loss: The x-axis is normalized compute; the three lines represent 1×, 2×, and 4× relative model sizes. Larger models and more compute generally lower validation loss in the tested range. Absolute parameter counts and the error of a held-out larger-scale forecast are not disclosed.
Closed-loop zero-shot simulation: The x-axis is again normalized compute, but the lines now represent relative pretraining-data scales. The y-axis is five-minute average task completion in Genesis World, not real-robot success. Genesis says no simulation data were used for training; each plotted point spans roughly 200 evaluation setups and more than 150 robot-execution hours. Running the full plot on physical robots would take about 2,700 human–robot hours.
Low-data real-robot fine-tuning: At 0×, 1×, 2×, and 4× relative pretraining data, mean success is 16.6%, 46.5%, 53.9%, and 65.6%. The tasks were excluded from pretraining, and Genesis says each internal evaluation task uses about 20–30 minutes of task-specific data. Pretraining helps under this protocol; the result was not calculated from the open-loop loss curve.
The company reports more than 200,000 hours in a heterogeneous data pool, but does not provide enough detail to convert the plots’ relative scales into absolute hours. Absolute model sizes and fitted laws are also undisclosed. Read these as three in-range results, not one law joining offline loss, simulation, and robot success.
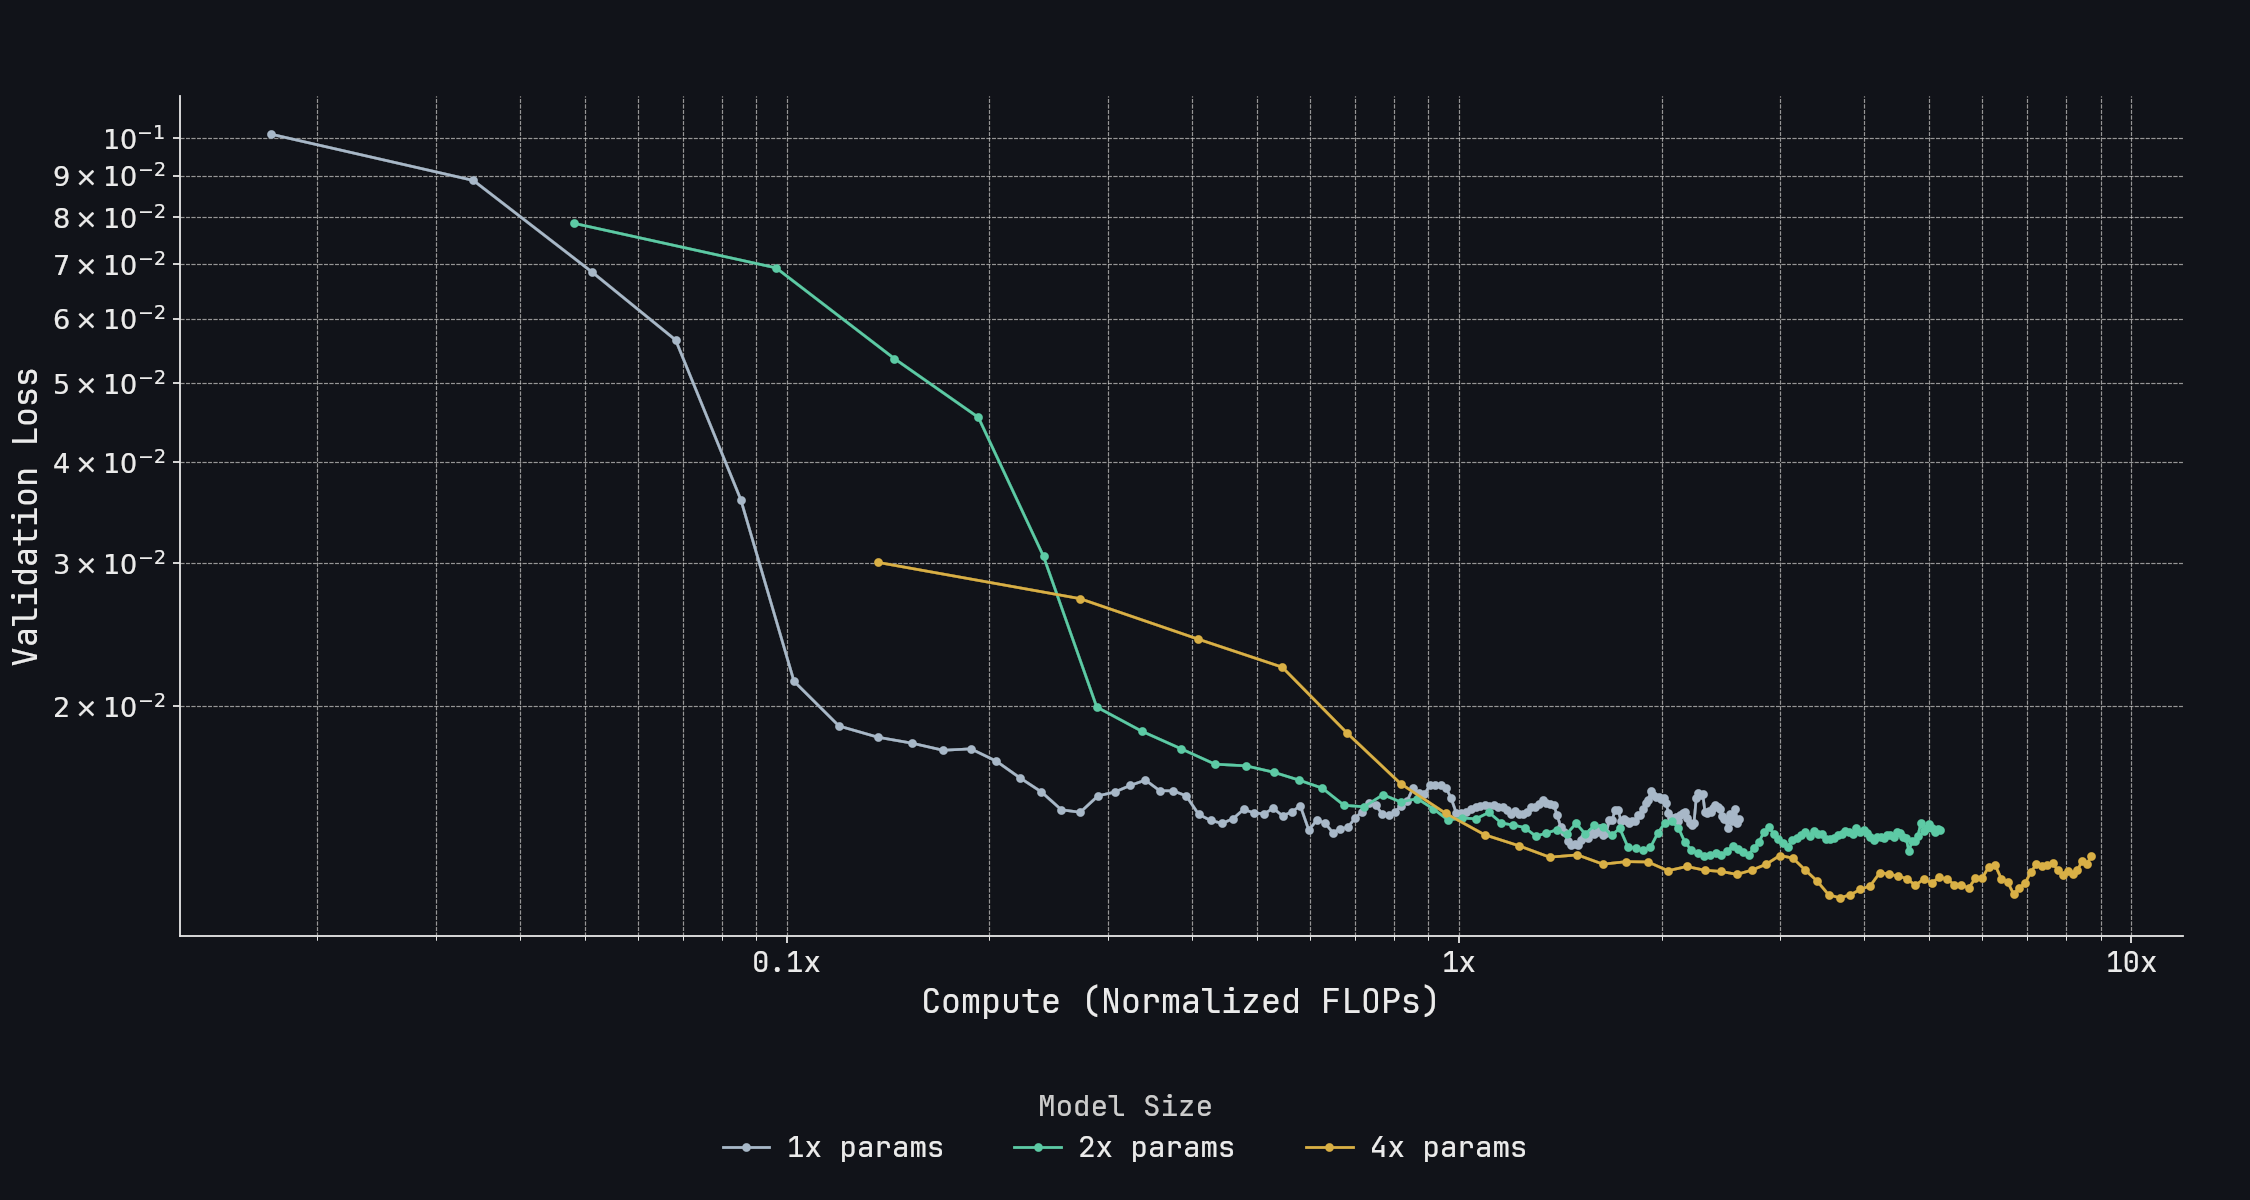
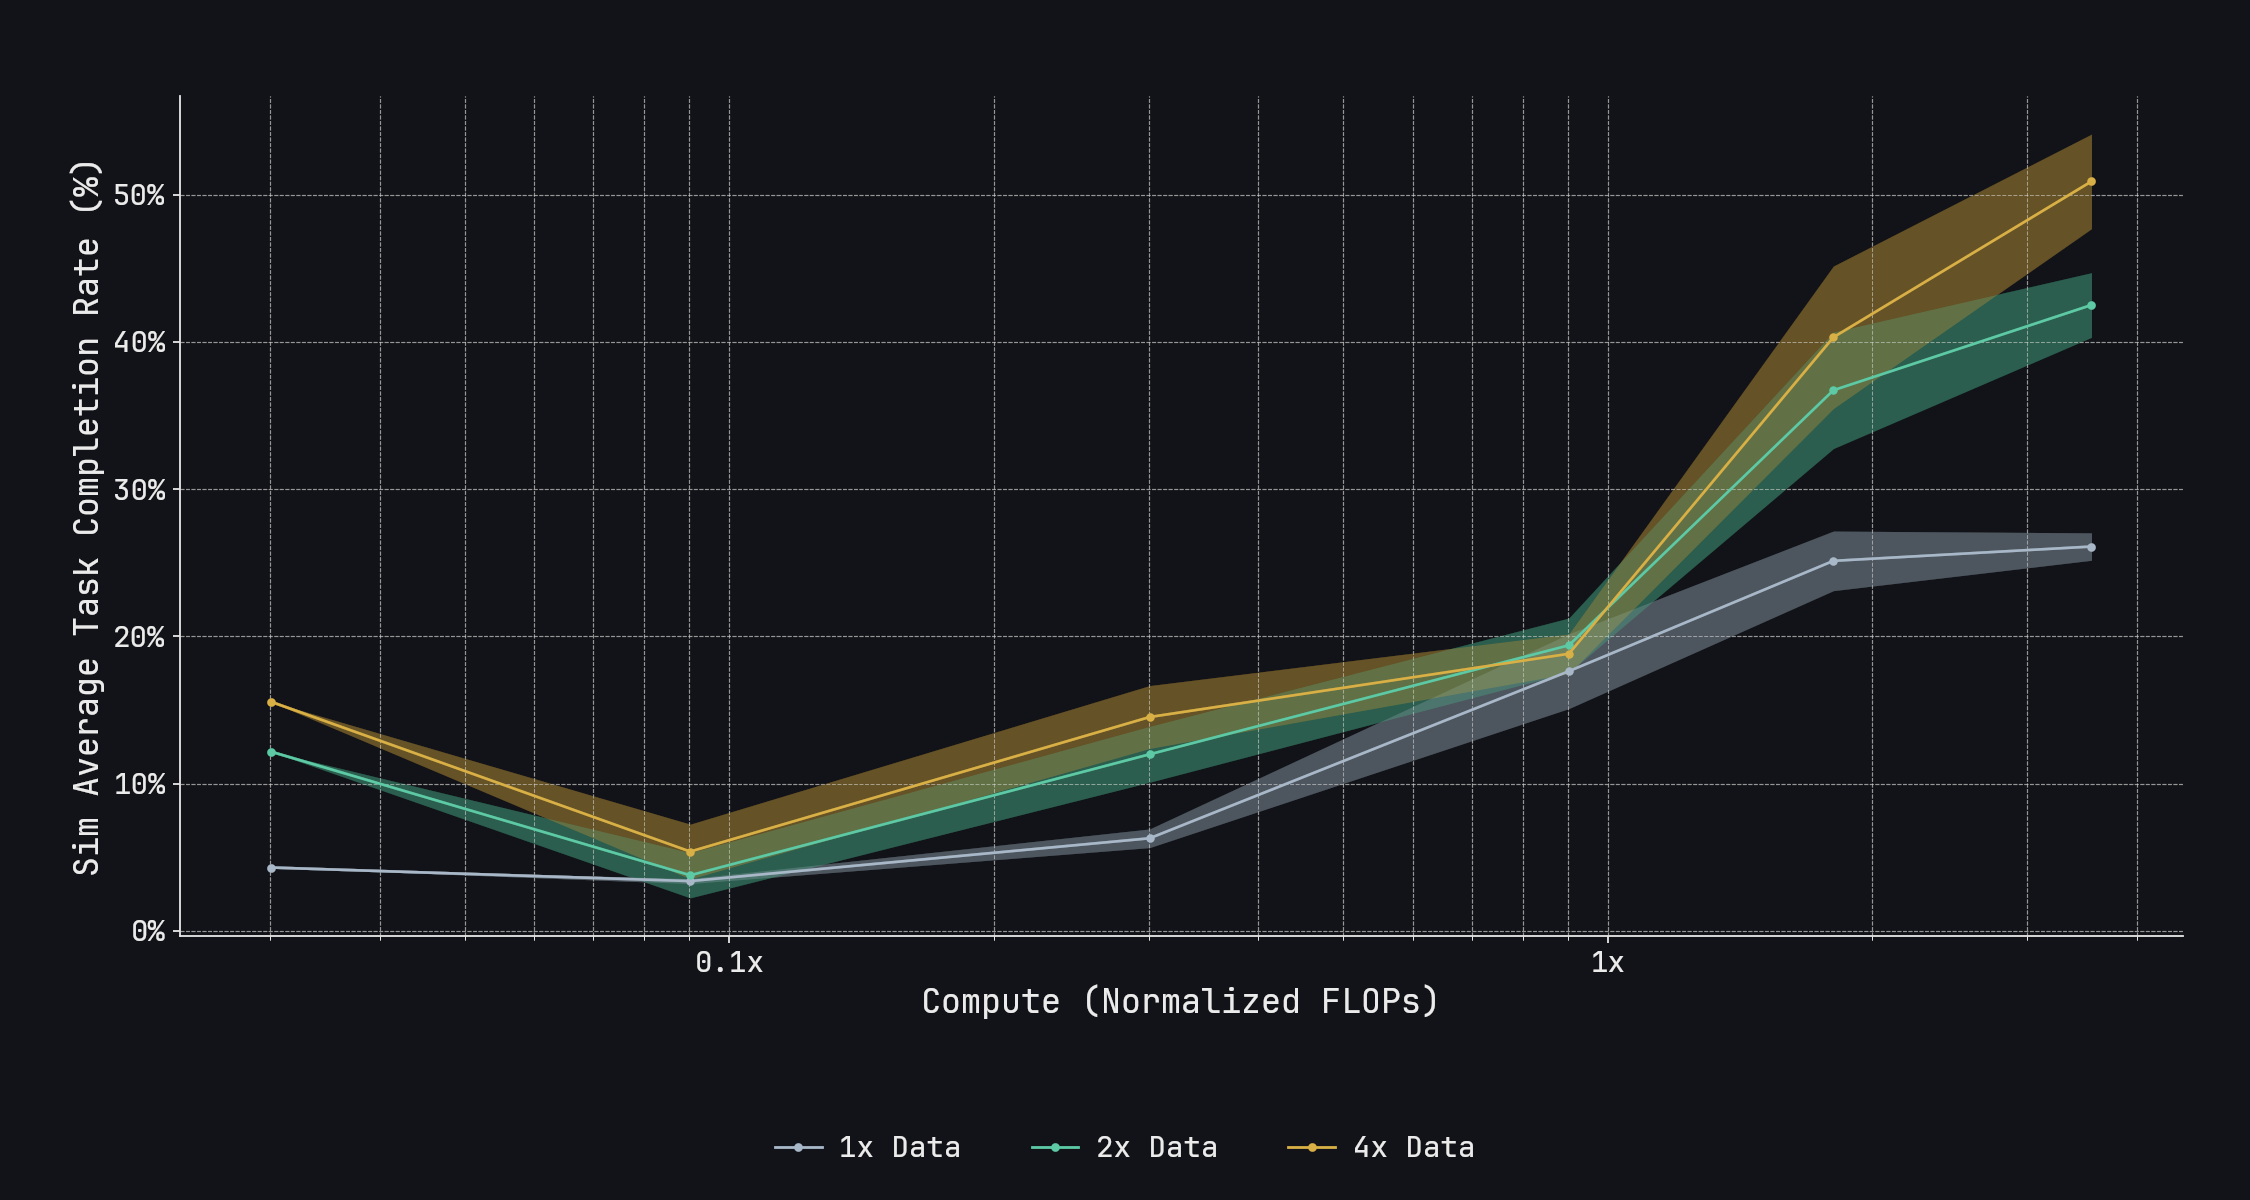
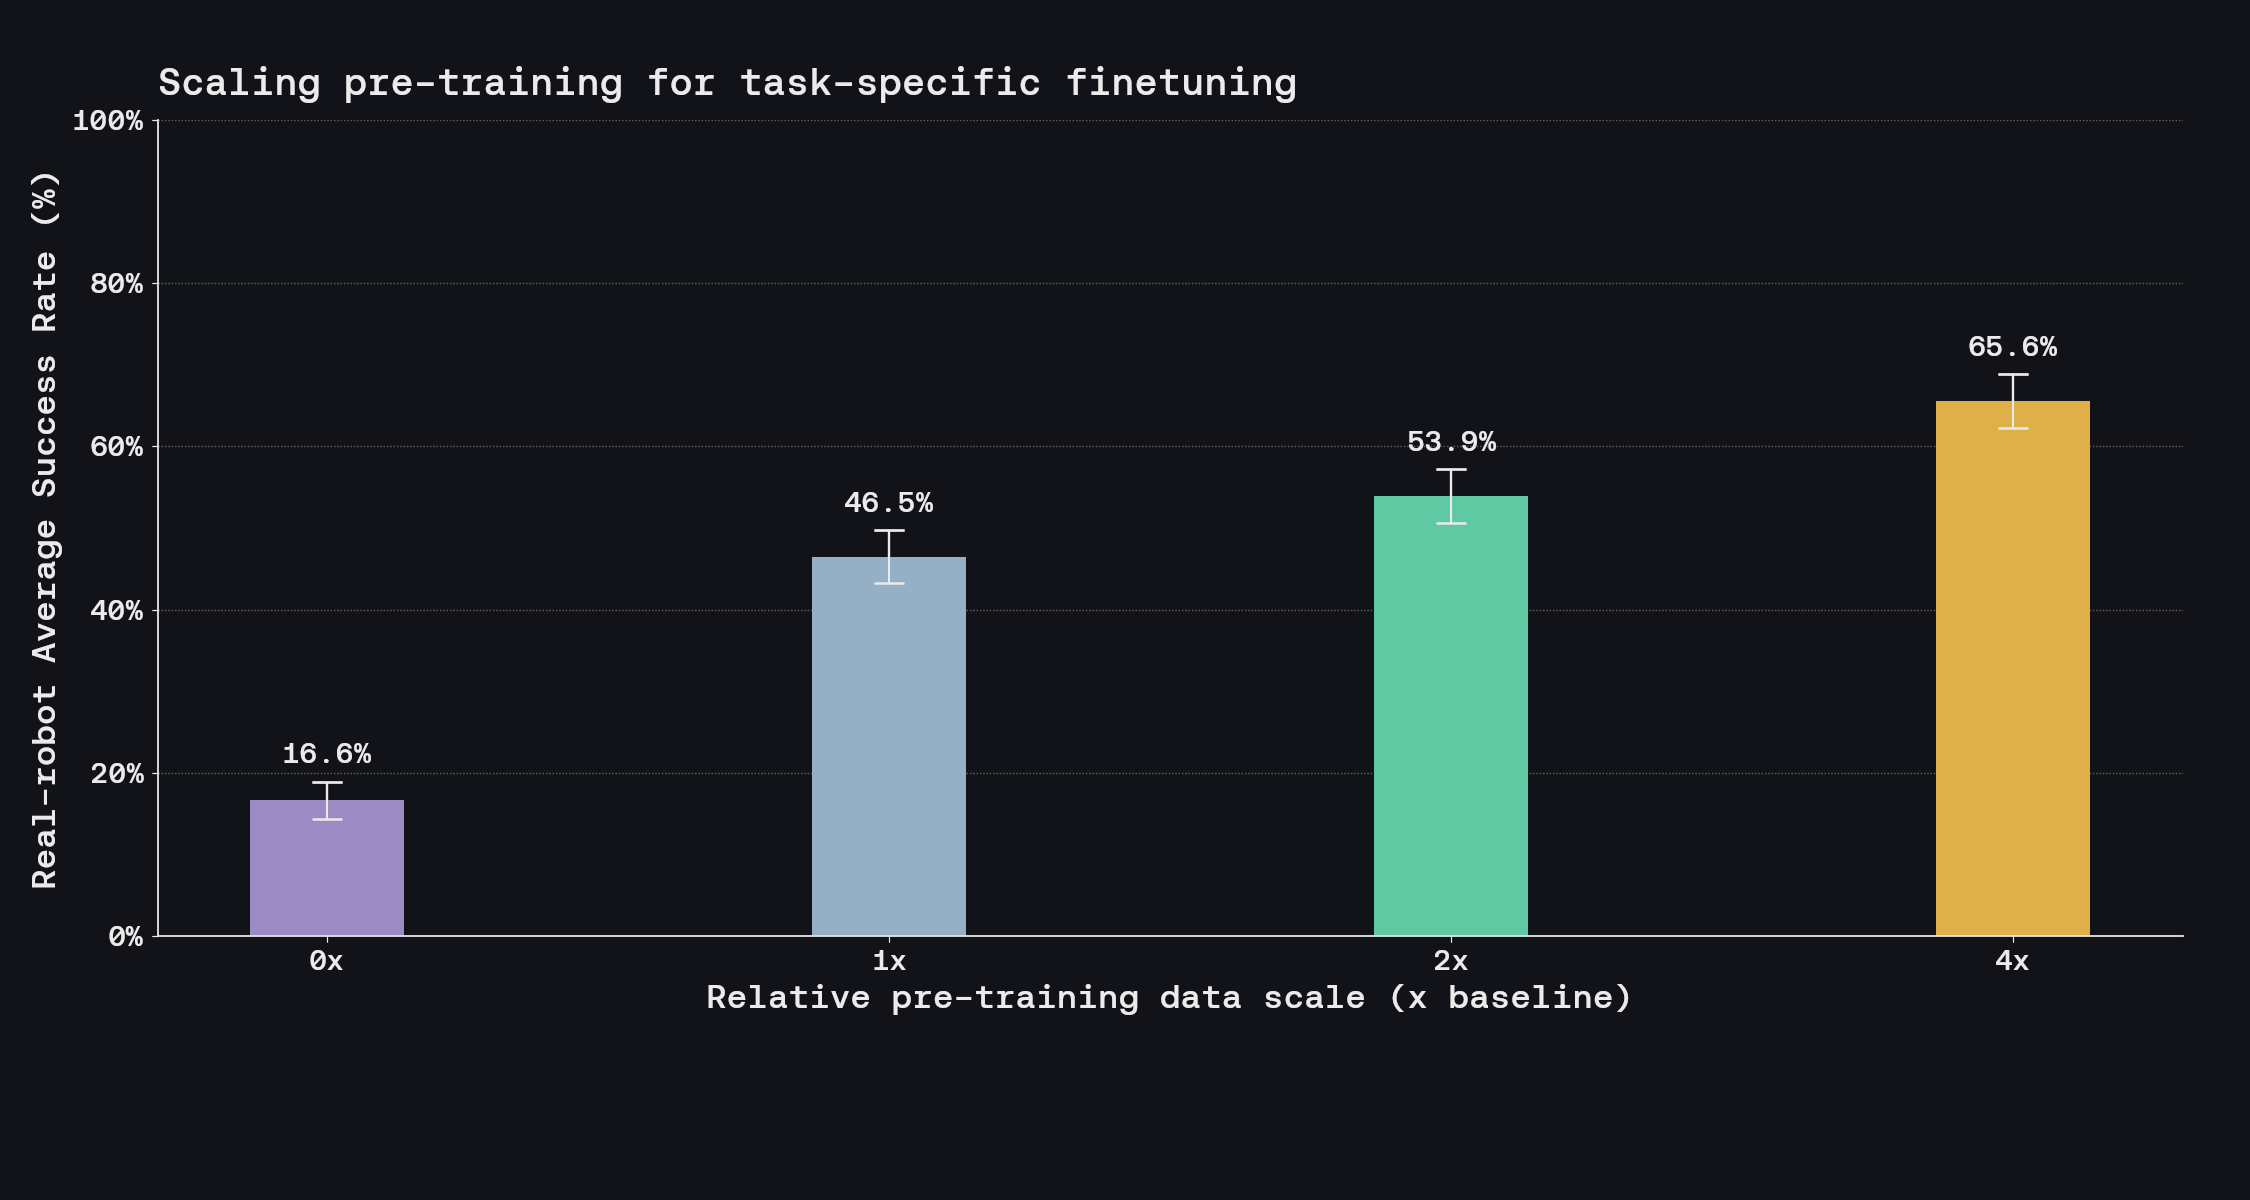
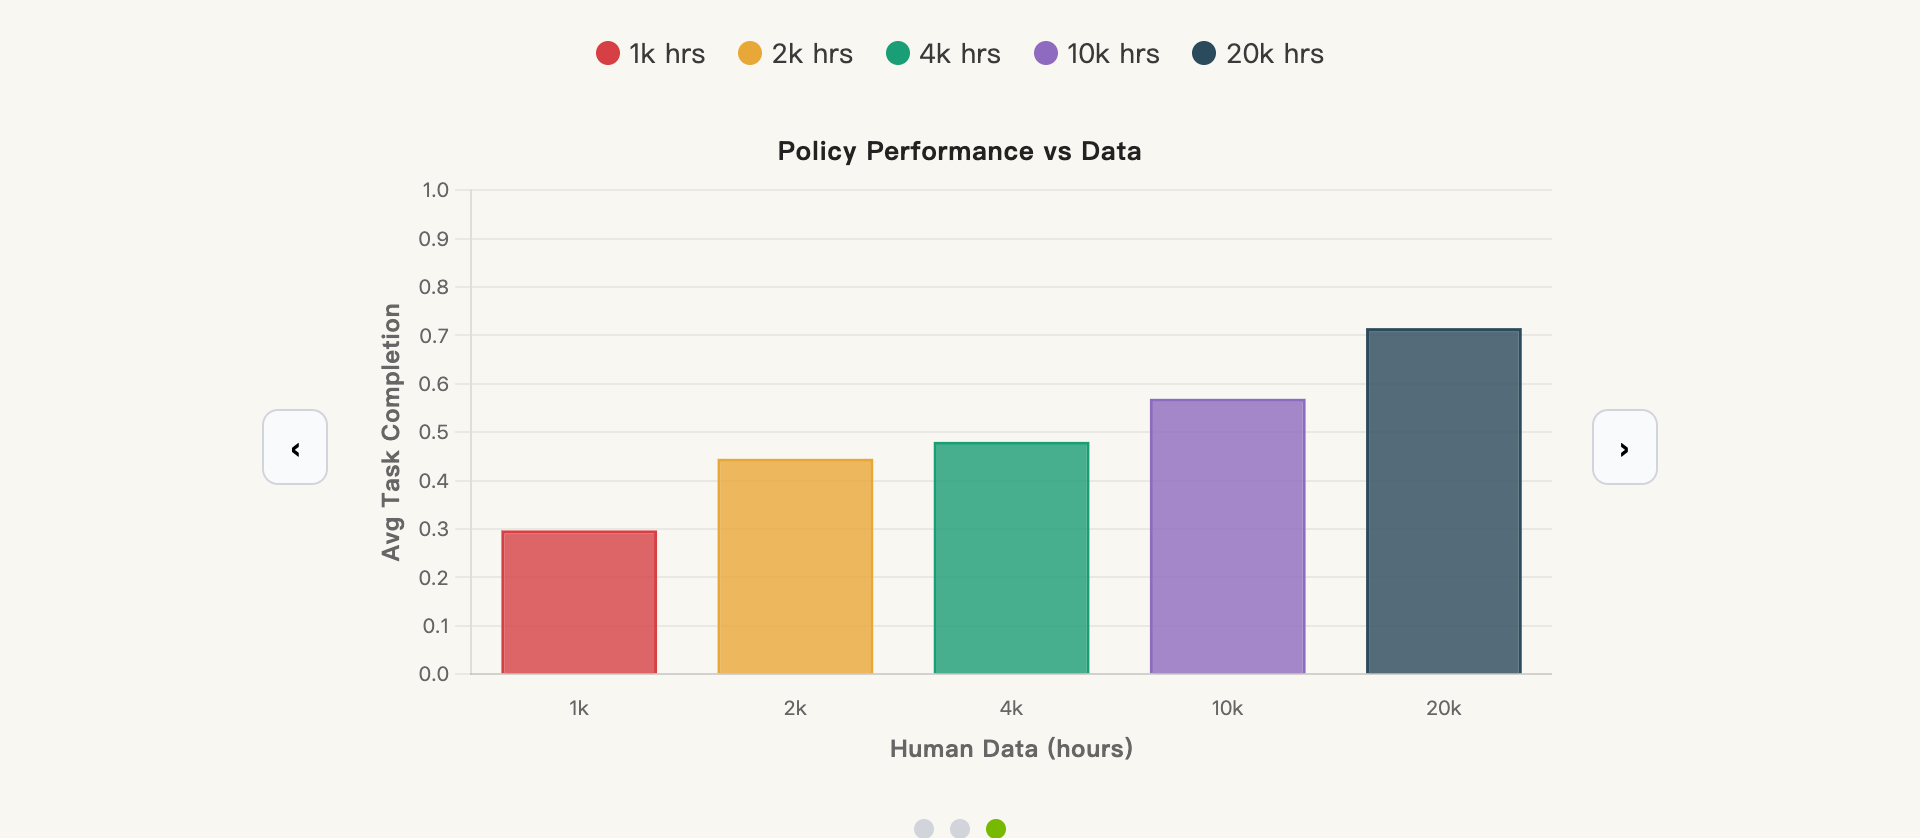
The three original charts show validation loss during training, a fit to converged loss, and post-training average robot task completion. They put both offline and robot outcomes on the page, but the y-axes differ.
R²=0.9983 describes the offline-loss fit; it says nothing about how well robot completion can be predicted. The robot chart reports five measured scales, with no larger held-out run testing whether loss predicts the next task result.
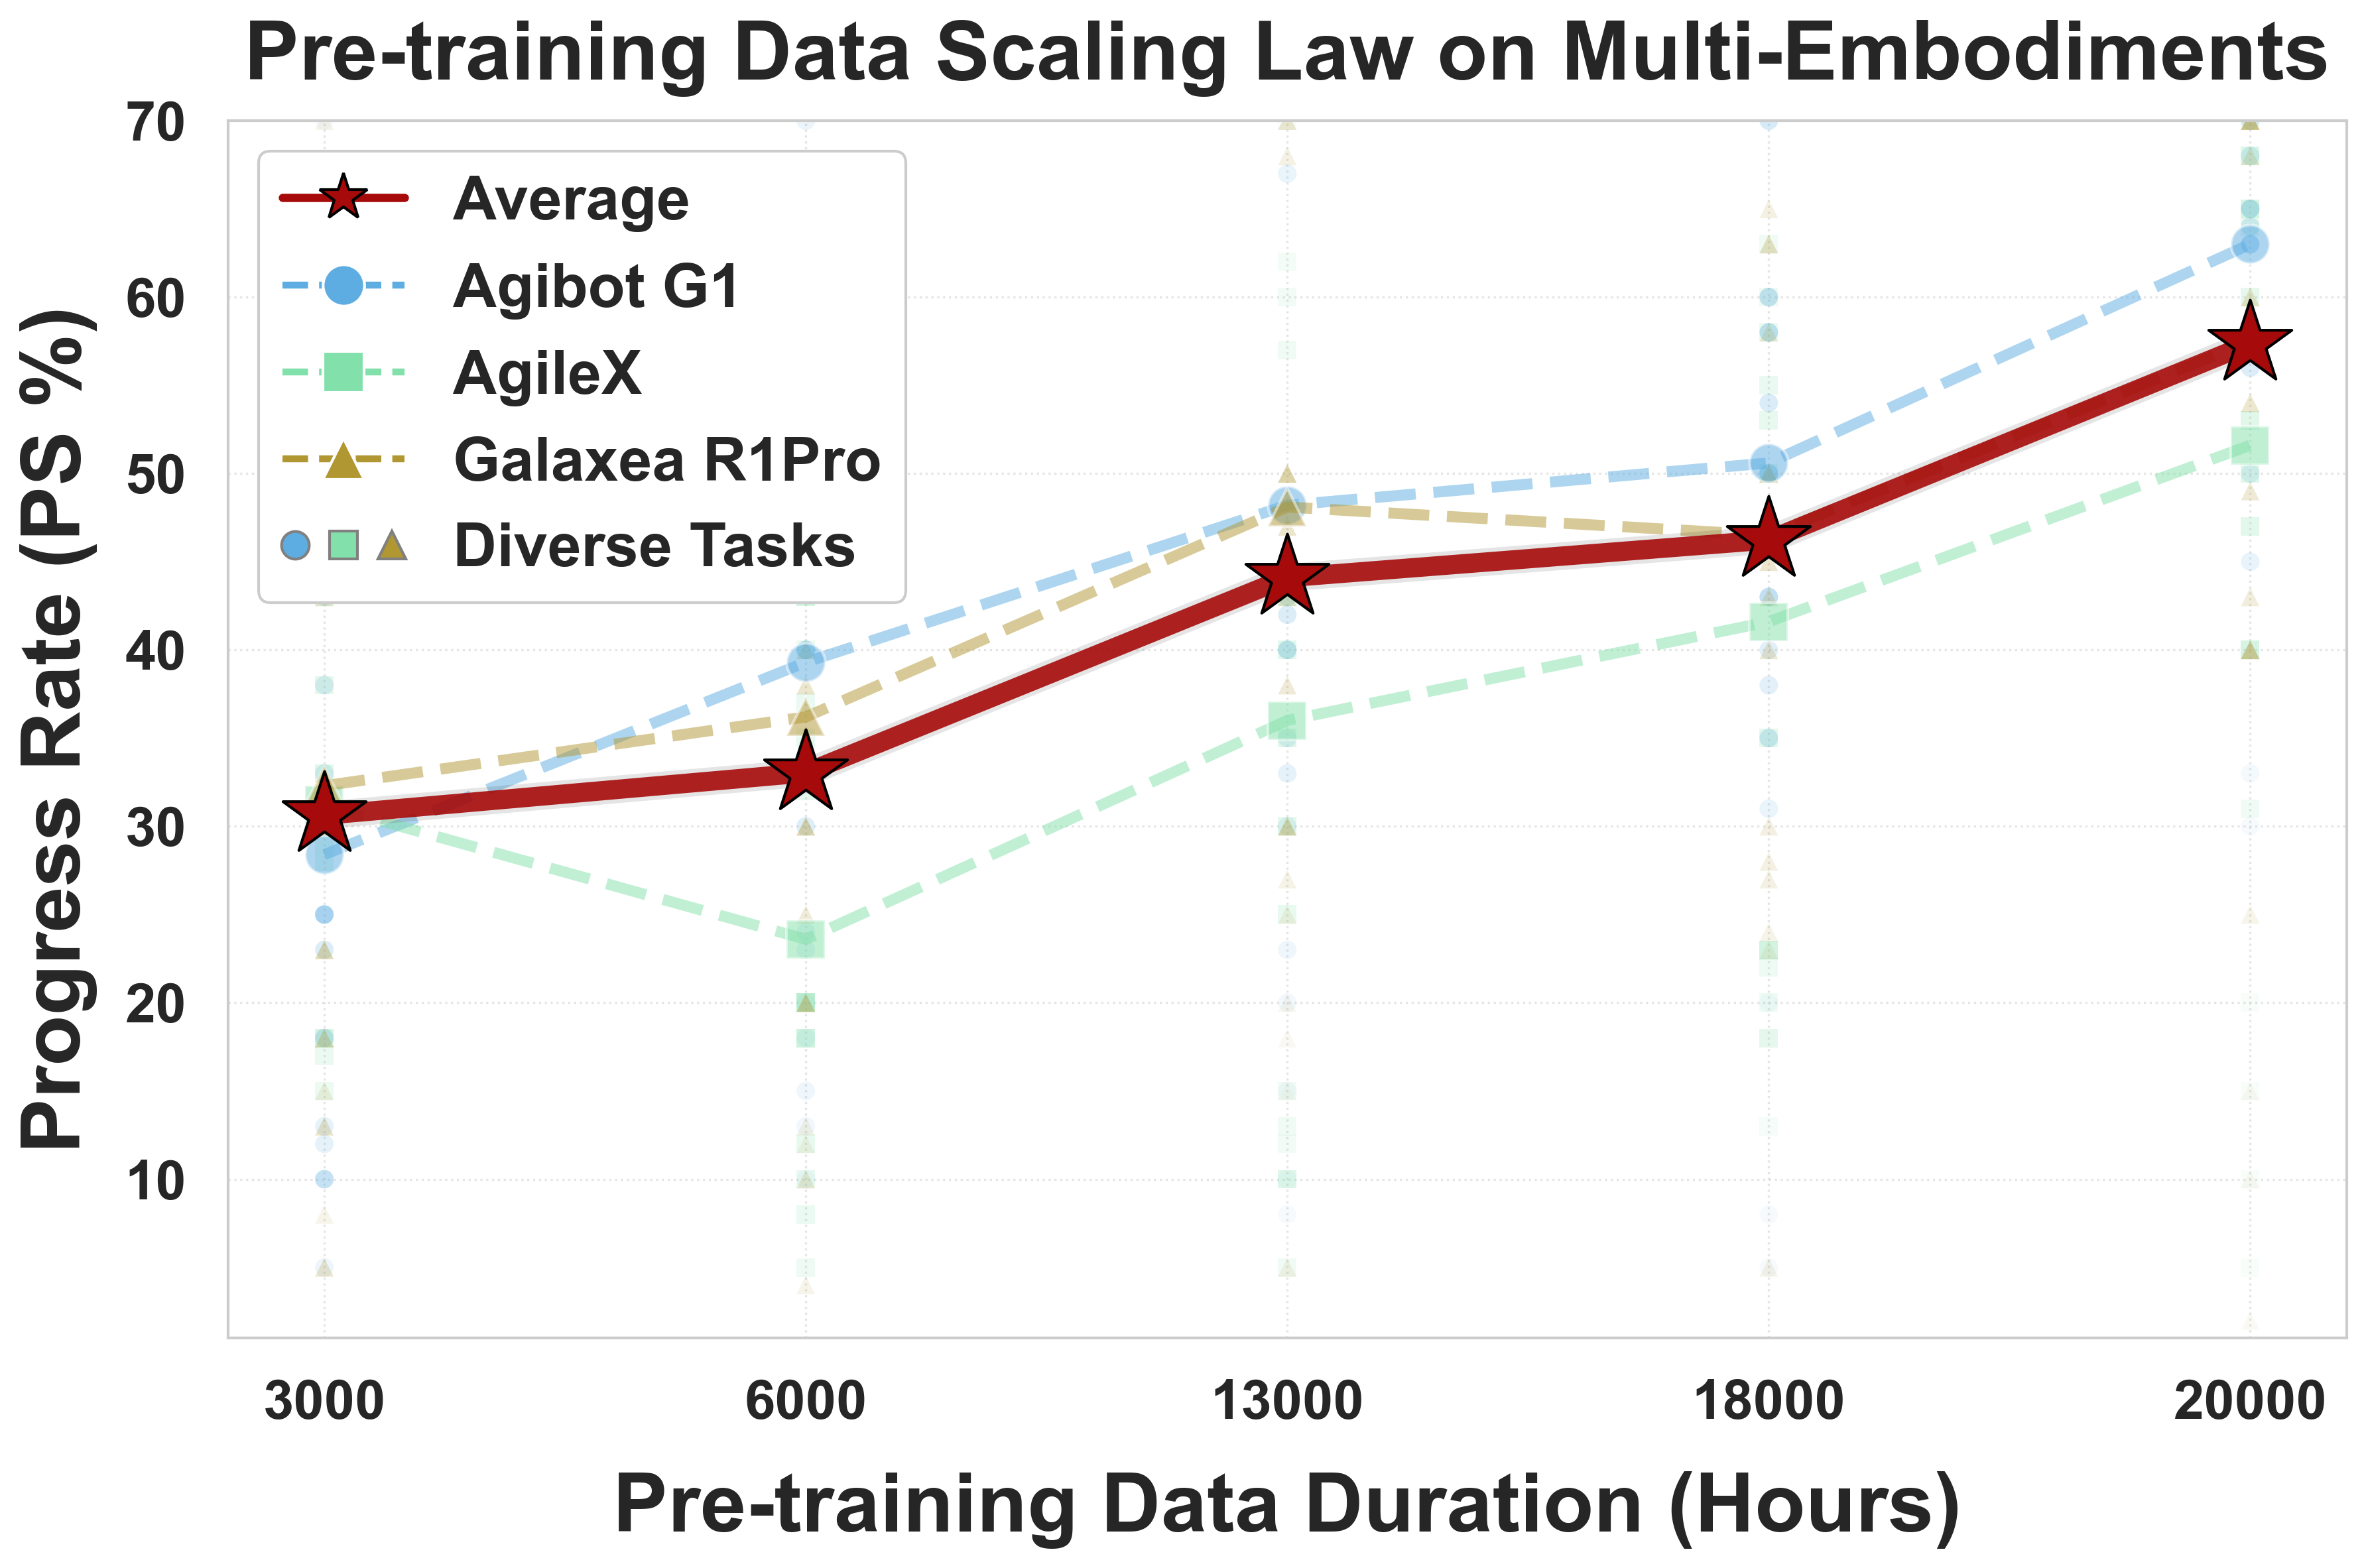
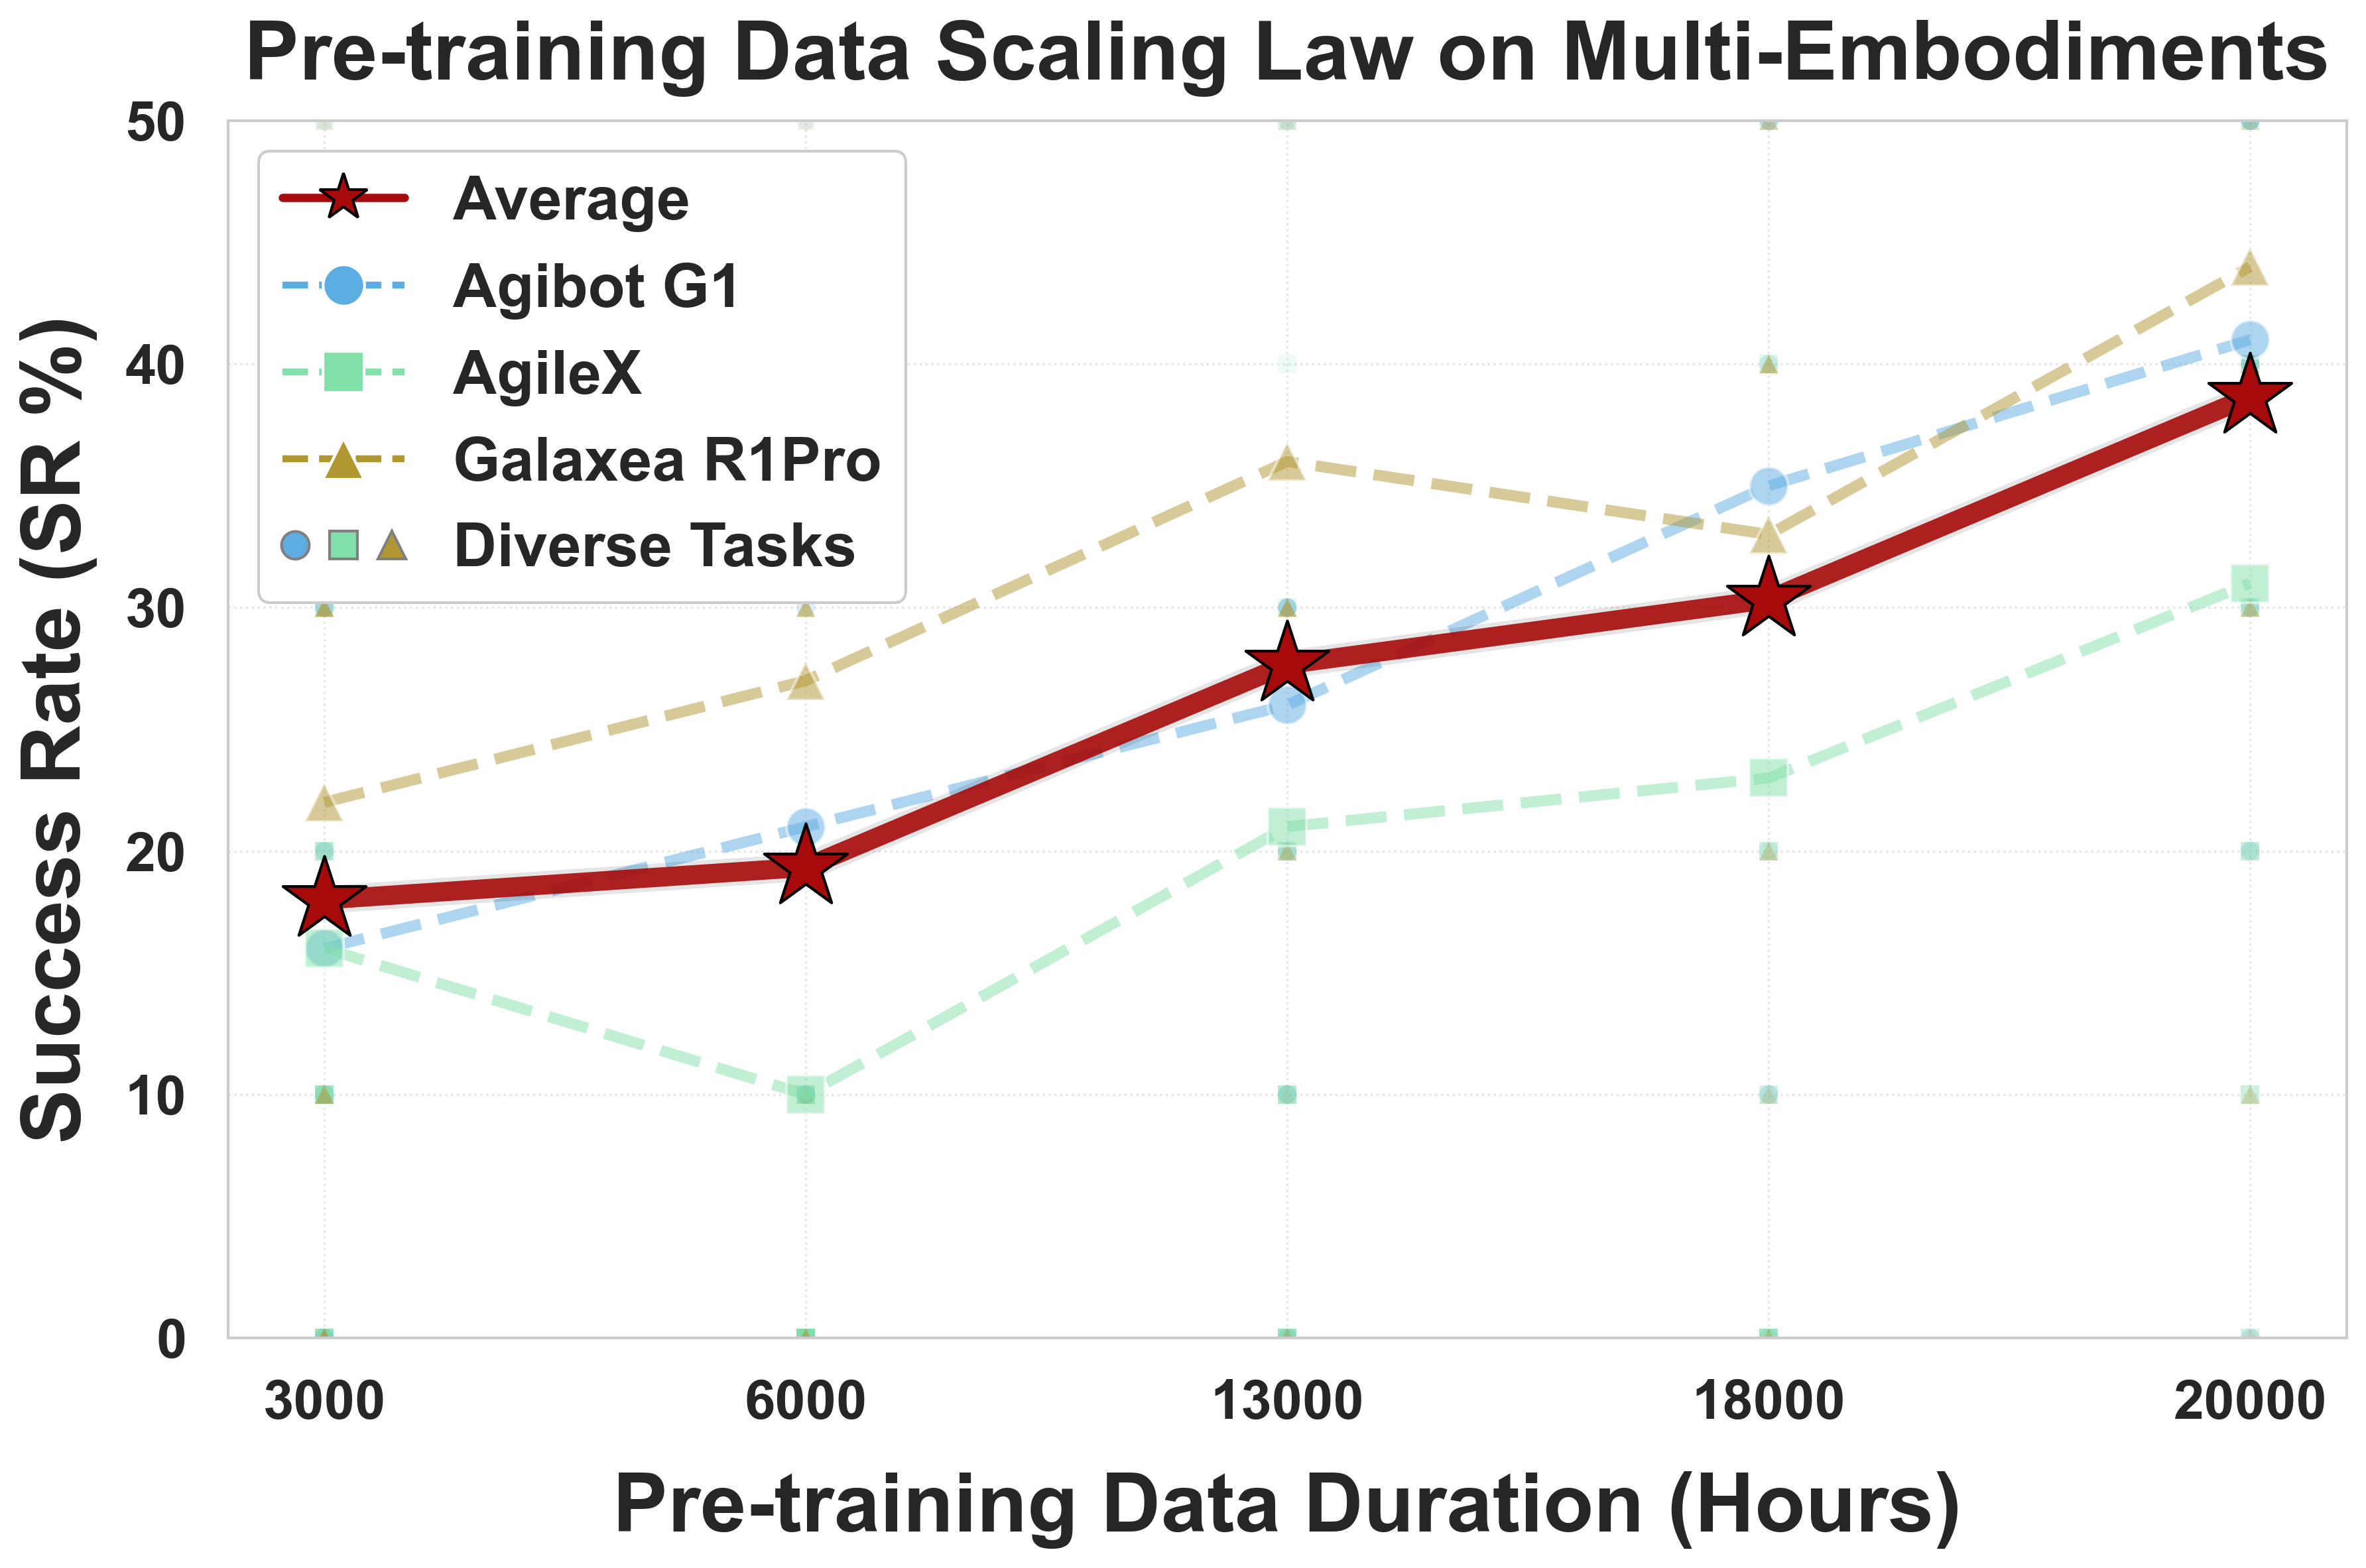
Paper Fig. 5 shows progress and success across 25 tasks. Red is the aggregate; the other three curves are individual embodiments. Both aggregate measures rise as pretraining data grows within the tested range.
Progress and success are distinct downstream metrics. These charts neither establish an offline loss law nor test a prediction beyond 20k hours.
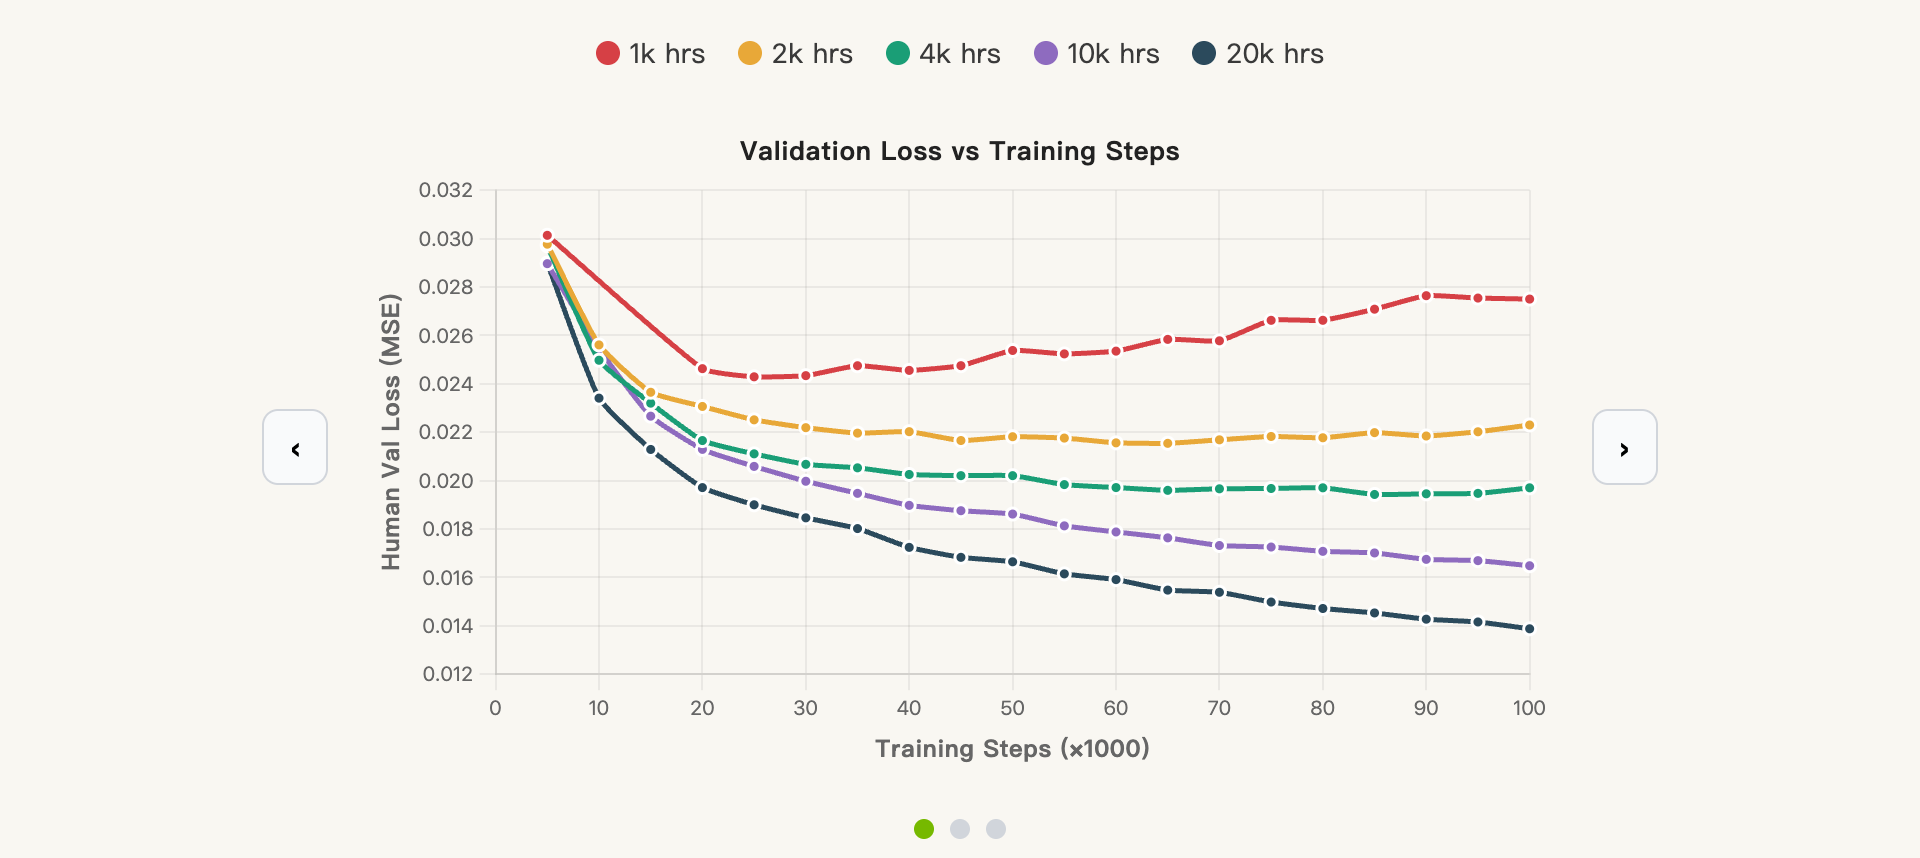
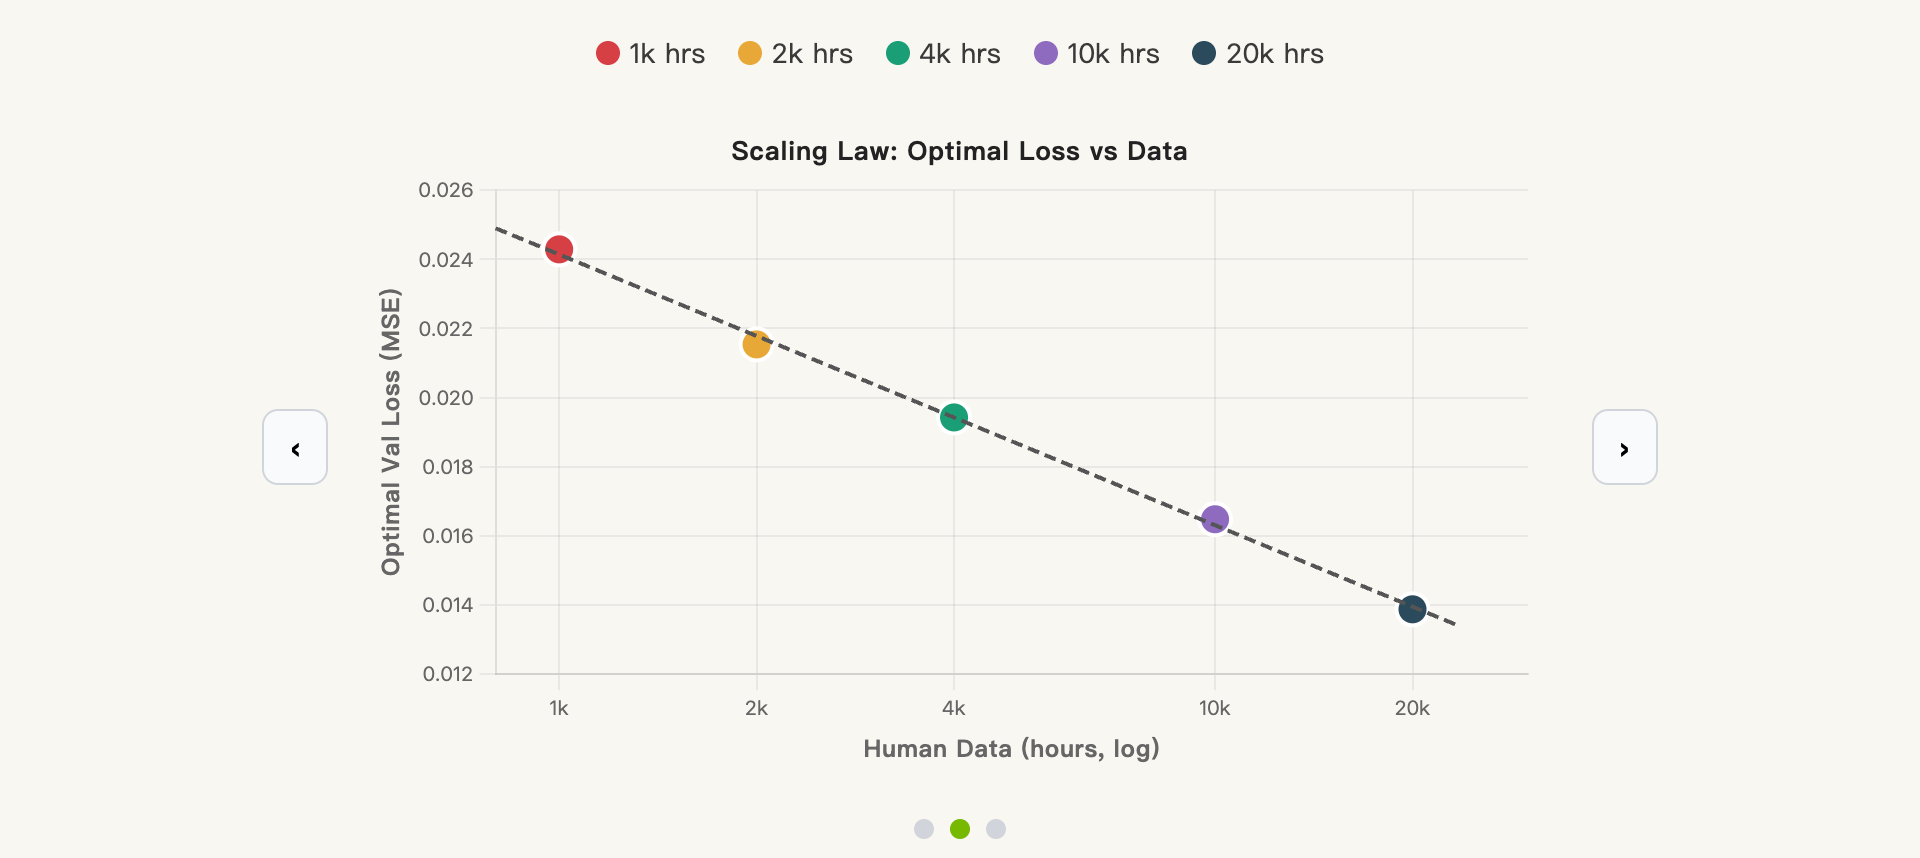
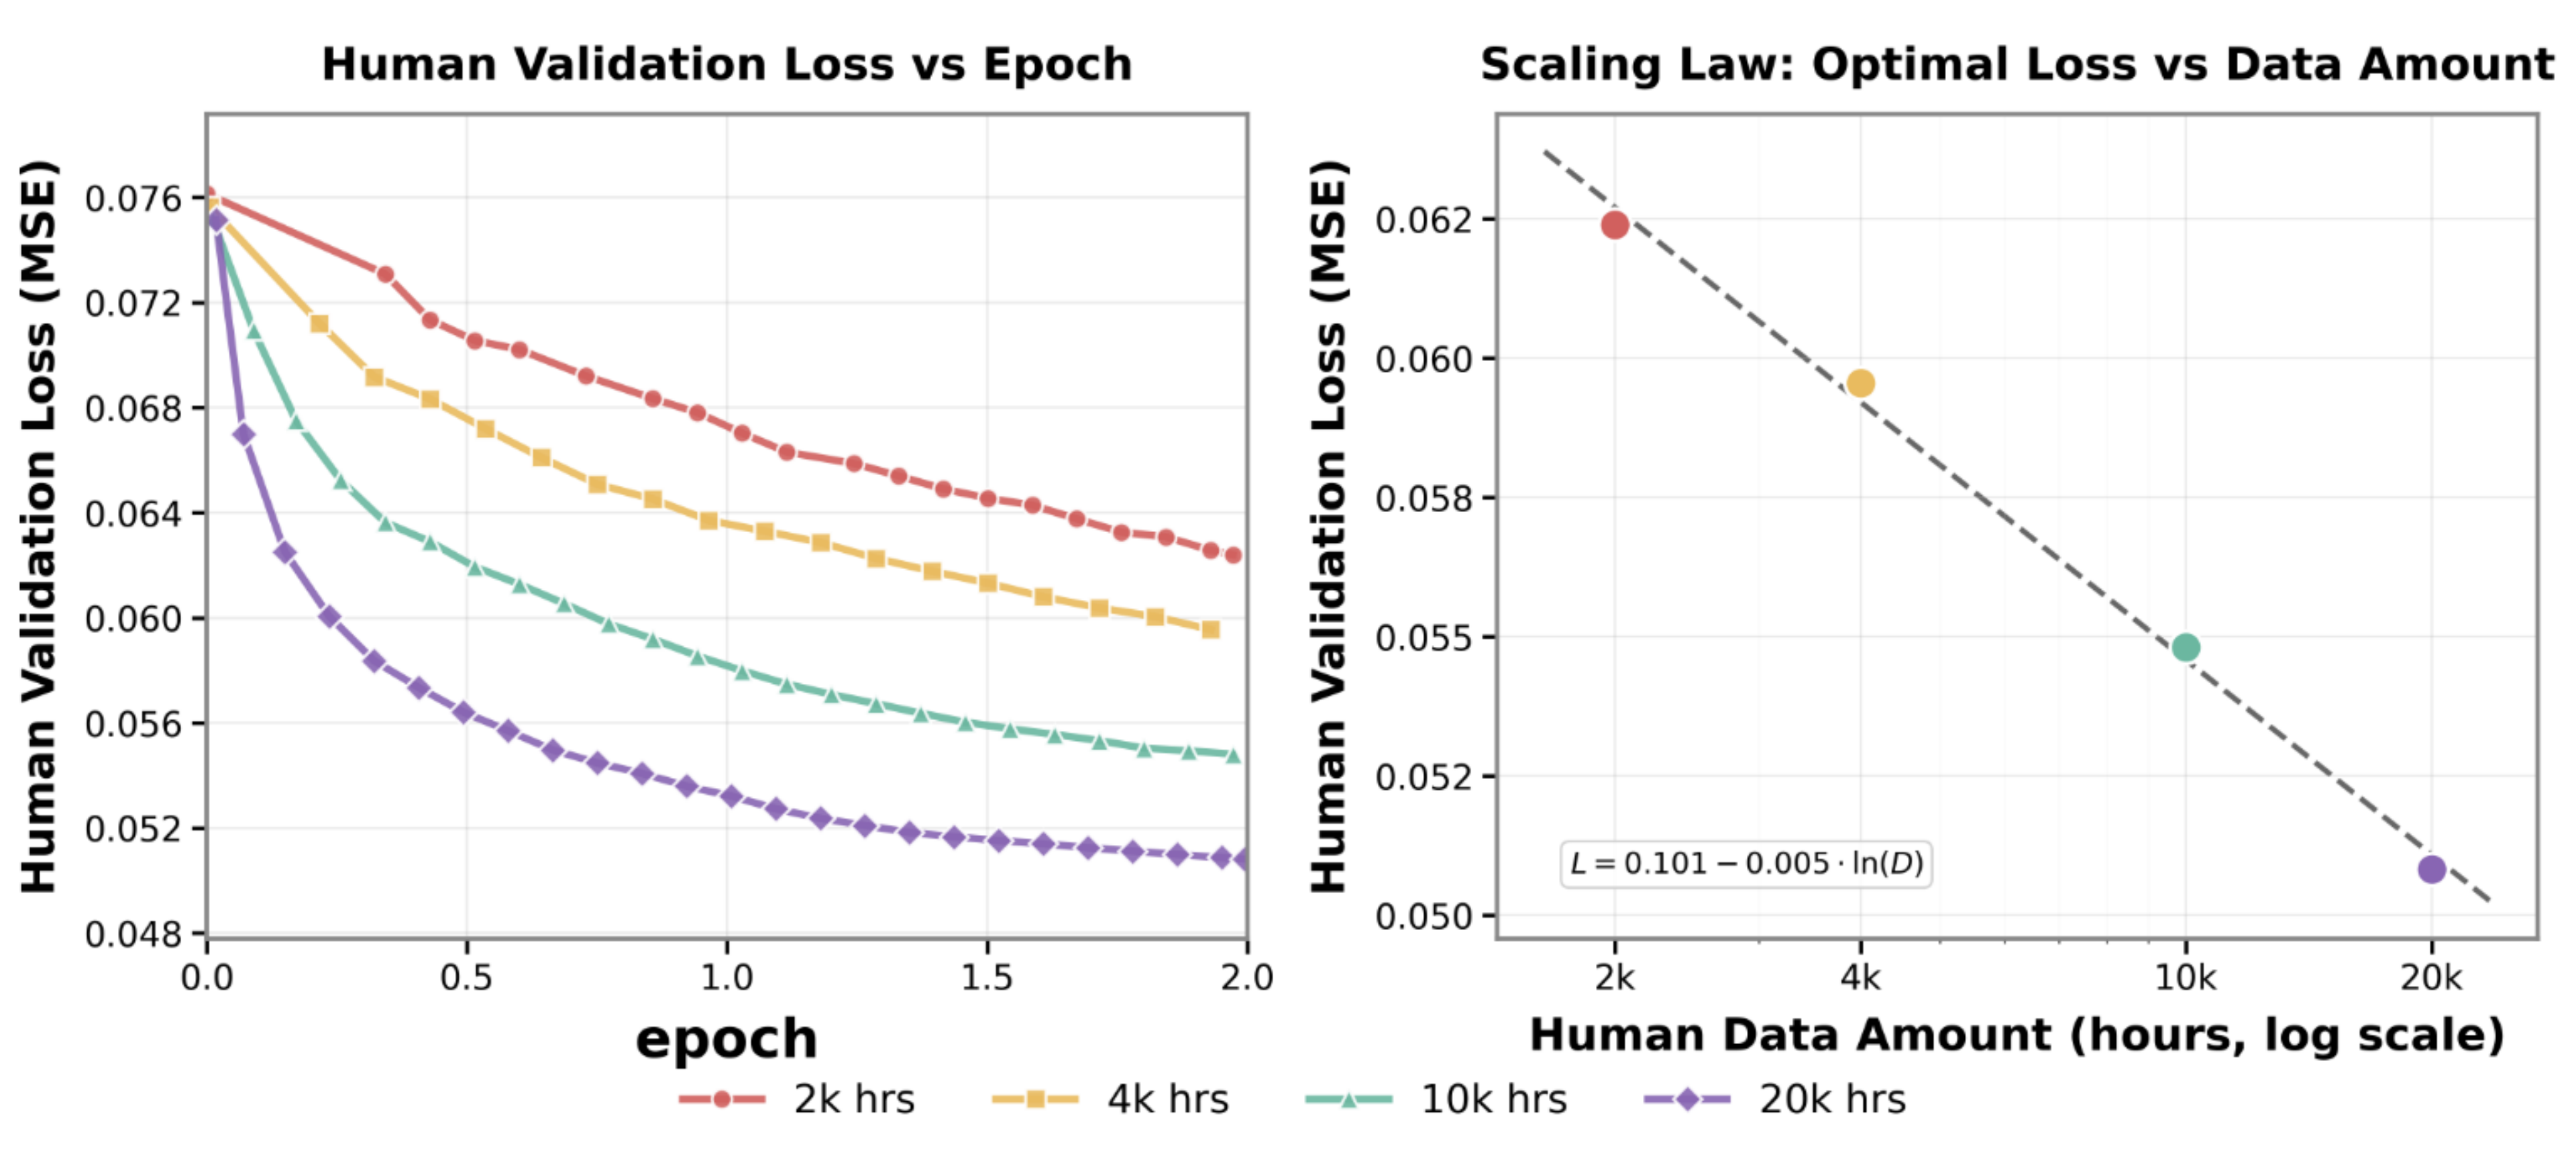
The original pair shows action-prediction validation loss during training and the optimal loss at four raw stereo-video recording scales.
Effective training duration is shorter after filtering. The y-axis measures action-prediction loss on held-out human data: a relatively clear local loss curve, but not a matched multi-scale robot-success experiment.
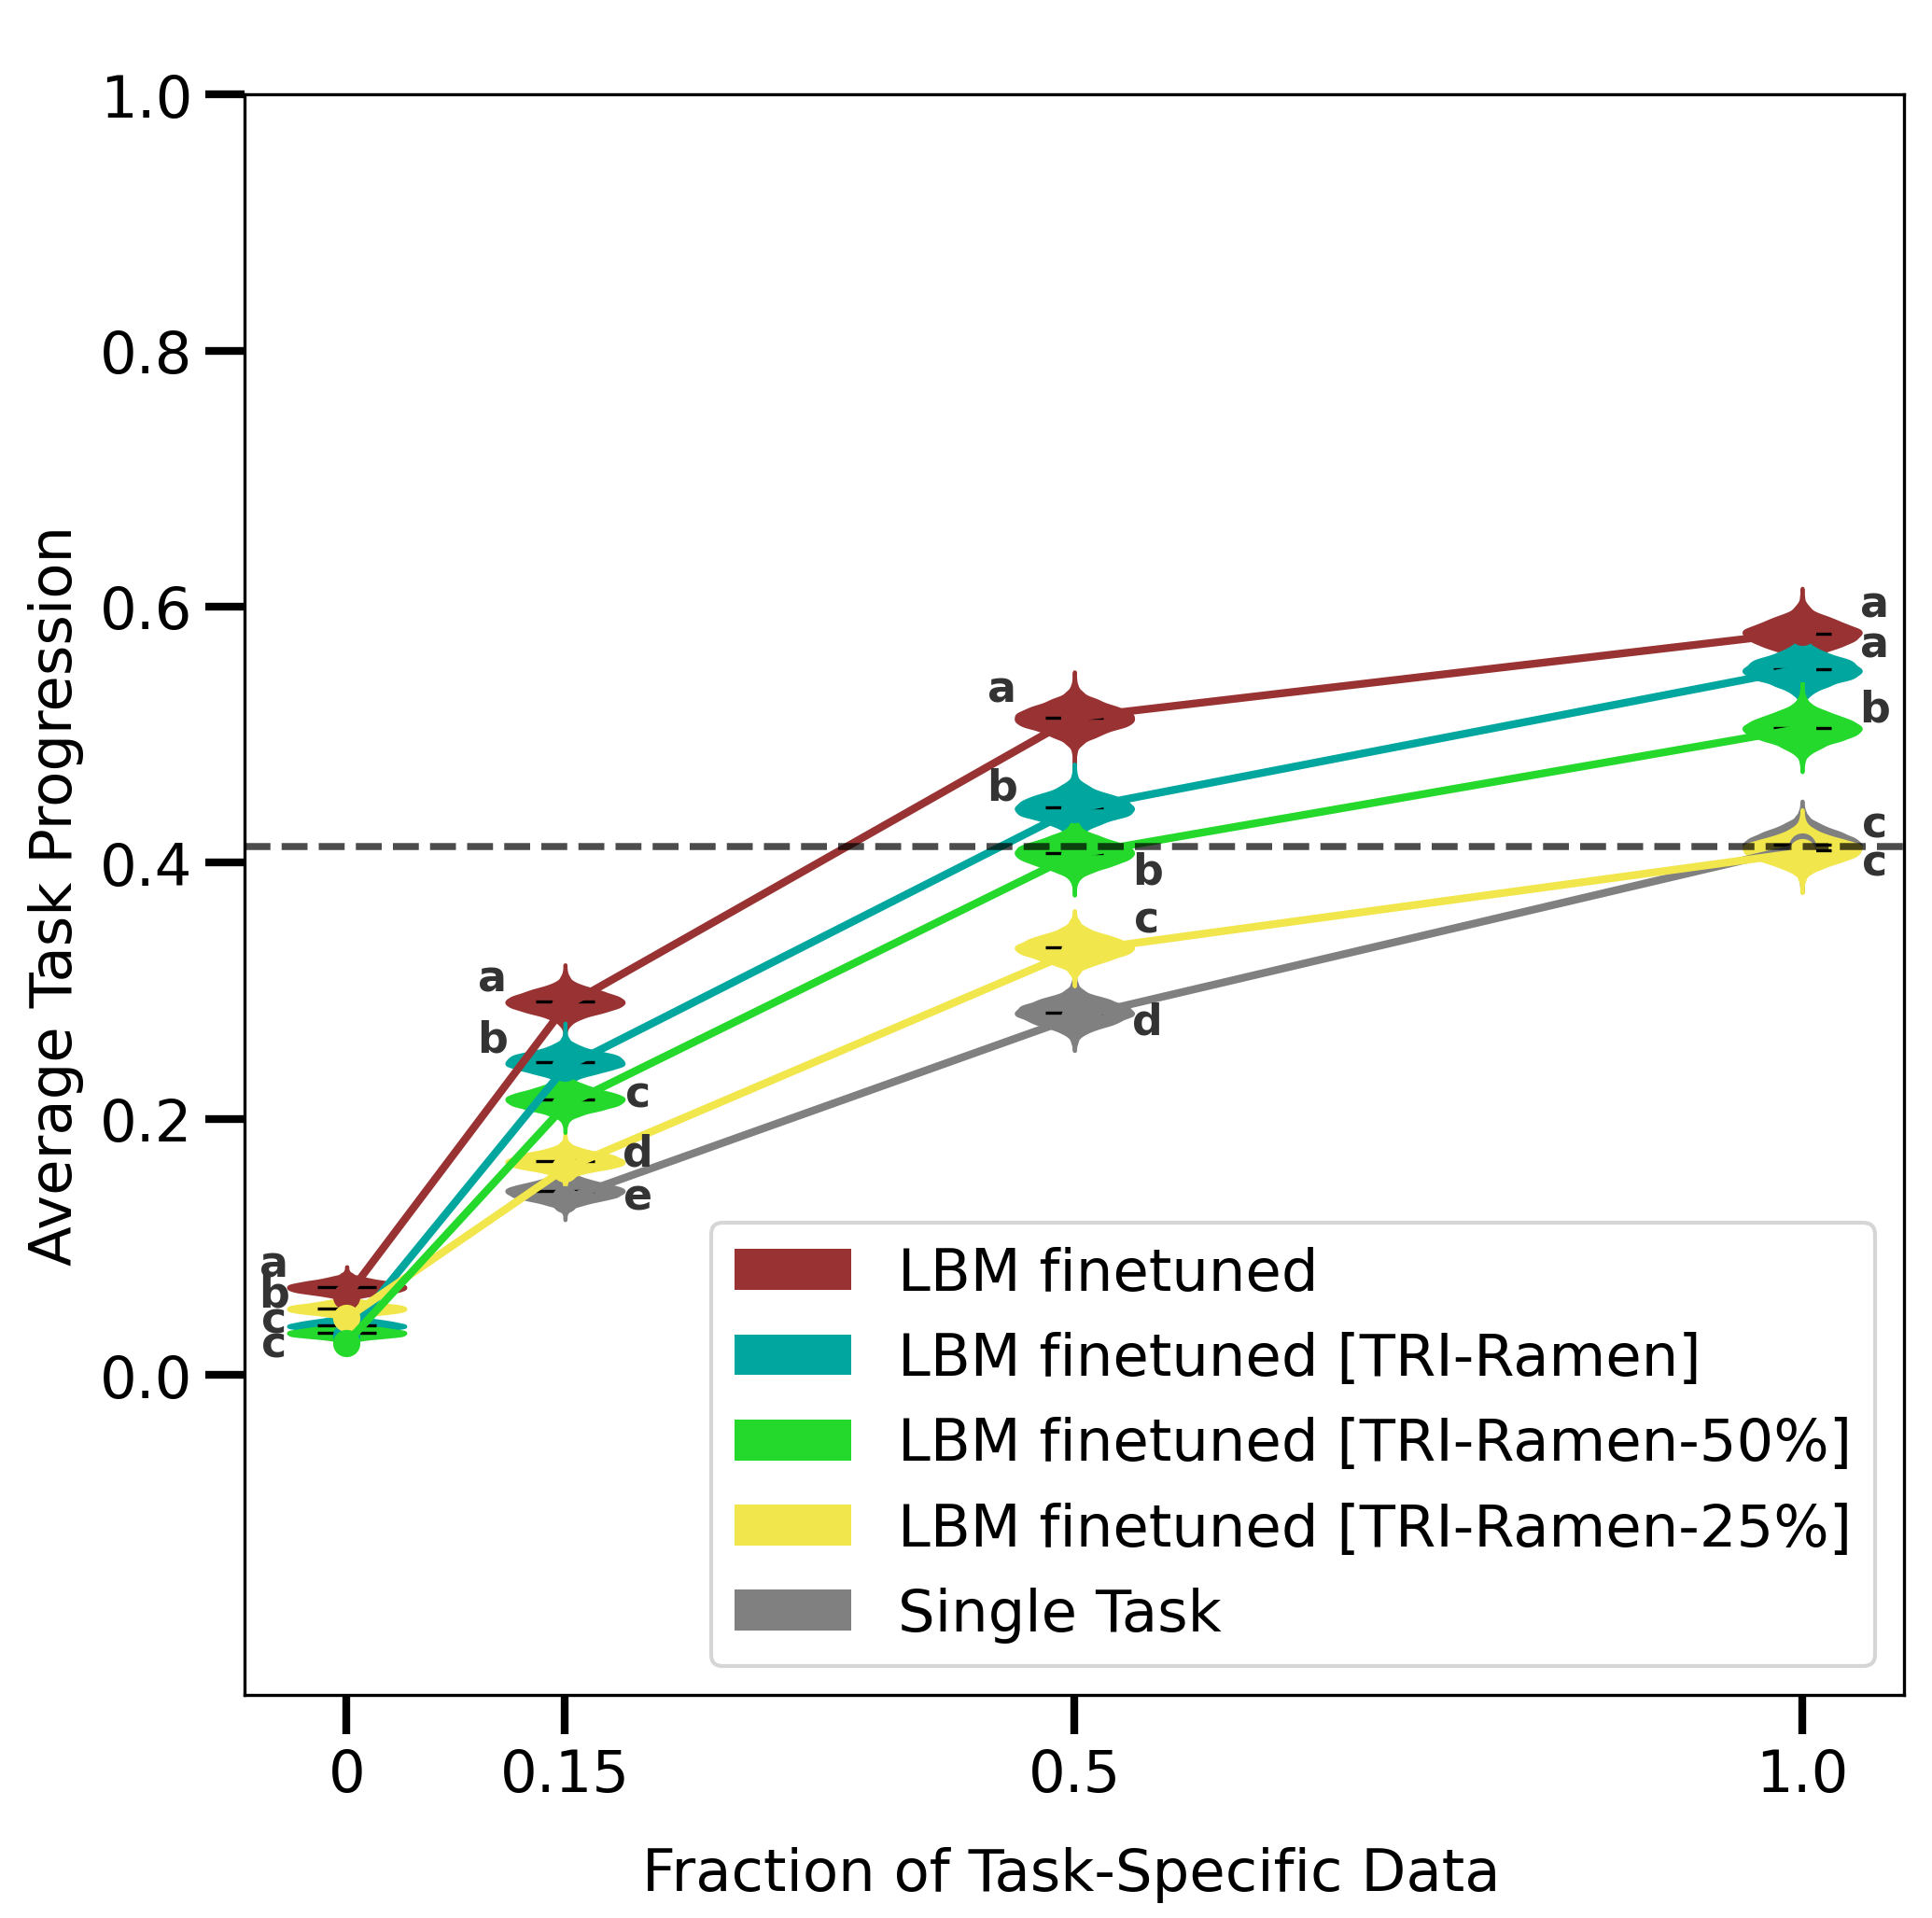
The original compares pretrained policies with a single-task baseline at different amounts of task-specific data. More diverse pretraining improves aggregate simulated task progression.
The y-axis records simulated task progress, while the x-axis records the fraction of downstream task data; these correspond to neither pretraining loss nor data hours. The result suggests that more diverse pretraining tasks can help downstream fine-tuning, but it cannot estimate robot success. The official page reports robot results separately.
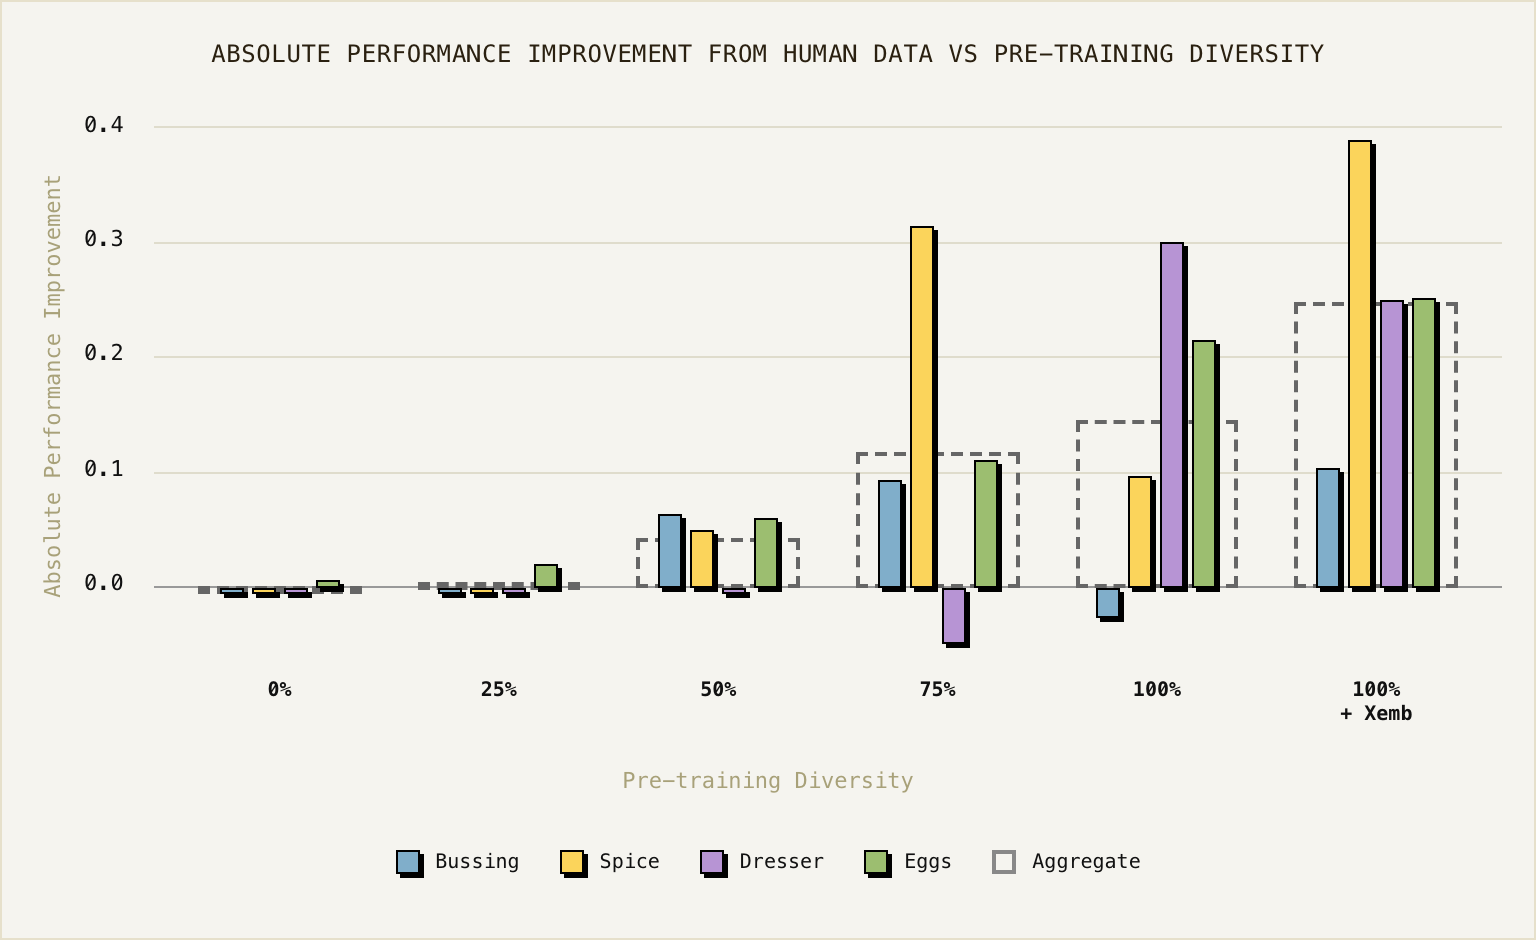
The official chart varies robot pretraining diversity on the x-axis and shows the added benefit of human egocentric video across four tasks. The far-right setting adds cross-embodiment robot data.
The x-axis is not human-video hours. Bar heights are the extra benefit of adding human data, not the policy’s absolute success rate. This is closer to a data-recipe comparison than a scaling slope for human video.
Limits of cross-company comparison
LLM loss can guide training partly because pretraining and validation distributions are relatively stable. Robotics has no agreed common distribution: the x-axis may be teleoperation, egocentric video, or wearable capture; the y-axis may measure human-action error, robot-action error, or no loss at all. Curves moving in a favorable direction do not make their slopes comparable.
Loss comparisons try to hold the test distribution steady. On real robots, moving a familiar task to another home, changing the task, and changing the embodiment are three distinct distribution shifts that should not be collapsed into a single notion of “generalization.” Success also depends on new-data allowances, weight updates, and intervention rules.
Helix 2.5 tests three full tasks in 30 unfamiliar homes. The homes and objects are new, but data collected elsewhere still defines the tasks. This asks whether a familiar task transfers to a new home—not whether the robot learns a new task with no examples. [6]
Skild S1 prompts the robot with a video of an unseen long task. Its main metric accumulates completed steps, and some comparisons allow a human to reset the scene after failure. Cumulative step success is not the rate of completing an entire task in one uninterrupted run. [11]
AGIBOT and LingBot test different robot platforms. Sensors, executable actions, and control rates may change along with the body. We need to know how much target-platform data was in training and how much was added before testing. [5] [13]
GEN-1.5 shows some short tasks and novel tool use after one or a few demonstrations, without updating model weights. That is a different kind of generalization from post-training on tens of hours of target-task data. [28]
One more axis runs through every test: how long can the robot keep working without help, and can it recover from failure? Real-robot reports should give uninterrupted full-task success, trial counts, task time, failure recovery, and intervention rules. Then we can at least see which robot gains accompany an offline loss improvement.
Data interfaces and budgets
Because an hour is not a universal robot token, the numbers below must be read within each data interface. They summarize the scales that public studies have actually tested and the models and metrics attached to them; they do not define an exchange rate or ranking across data sources.
Xiaomi's four-task mean success rises in the measured range, but its 100k-plus total pool has no corresponding sweep. Sunday's selected 12.5% beats a uniform 50%. Collection and filtering change the data distribution; hours alone cannot forecast the next loss or robot result.
Model size: at roughly 20k fixed hours, 5B→10B adds four points in four-task mean success; a joint optimum is unknown.Dyna and Motus2 measure action error on their own human or robot evaluation data; EgoScale also tests post-training robot completion. Helix discloses only relative Index scale. Their target distributions differ, so no shared hour threshold for cross-embodiment transfer follows.
Model size: most studies hold it fixed, so a parameter-to-hours ratio cannot be derived.Isaac quantifies a video–teleoperation exchange at fixed offline action loss; Rhoda reports robot results on a particular industrial task. “Equal loss” cannot directly be turned into “robot collection cost saved.”
Model size: Rhoda's XS–L trend is positive; absolute parameters and video volume are private.ABC sweeps 1k–10k hours of low-cost bimanual teleop and relates offline action error to real-robot outcomes. TRI, LingBot, and AGIBOT report simulated progress or robot-task gains under their own protocols. RT-X compares mixed training with partner labs' original methods rather than measuring several scales. These results demonstrate manipulation capabilities, but not a loss law reusable across platforms under one loss definition. Robot data and multi-platform integration are costly.
ABC's DiT-S→xL sweep shows training loss falling with capacity; most other studies fix the model or change it with data.Chinchilla scaling allocates parameters and tokens at fixed compute to lower pretraining loss. Xiaomi compares 2B, 5B, and 10B at roughly 20k fixed UMI hours on task success; ABC sweeps DiT-S→xL on training loss and compute efficiency; Being-H0 compares five data scales at fixed 8B on offline hand motion. A full model × data grid on one target distribution is still missing.
This table is a working hypothesis based on the kind of supervision each data source provides. The actual order of investment still needs matched loss experiments, robot evaluations, and cost records.
| Project | Data interface | Disclosed scale and outcome | Model-size information | Scope and gaps |
|---|---|---|---|---|
| Generalist [9][10][28] | Large physical / ego mix | GEN-0 ≈270k h; GEN-1 over 500k h with recipe changes | ≈7B threshold is directional | GEN-0 has internal sweeps; the two releases are not a data-only sweep |
| Figure [4][6] | Task robot + Index human data | Local tasks need tens of hours; 8× Index data still lowers loss | Model fixed | Offline forecast; separate with/without-pretraining robot test |
| Xiaomi-Robotics-1 [7] | UMI | 2.5k→20k h keeps improving; 100k pool not swept | At 20k h, 5B approaches 10B | Two quantitative axes; joint grid missing |
| Dyna-2 [1] | Ego human video | 1k→1M h; human-data accuracy@0.5 ≈40%→47%, robot mean normalized score 20%→53% | Model fixed | Gains differ by metric; cost return on final 900k h undisclosed |
| Rhoda [2] | Web video + task robot | Pretraining matters most when downstream data is scarce | XS–L trend positive; absolute scale private | Strong within one task |
| Sunday ACT-2 [3] | Glove / dedicated capture | Selected 12.5% can beat uniform 50% | Undisclosed | Absolute scale unavailable |
| Isaac 0.5 [8] | General video + multi-system robot | 1M video sharply reduces teleop at equal loss | Only a 36B flagship point | Iso-loss contour is quantitative |
| AGIBOT GE-Act 2.0 [5] | Robot / video mix | 300→30k h expands zero-shot capability breadth | Model fixed | Four measured scales; no extrapolated forecast |
| Skild S1 [11] | Mixed video / robot | 1k→100k h improves unseen long tasks | Model fixed | Step metric limits end-to-end extrapolation |
| EgoScale [12] | Ego human video | 1k→20.9k h is near log-linear and robot completion rises | Model fixed | Fit within range |
| LingBot-VLA [13] | Multi-embodiment robot | 3k→20k h shows no clear saturation | Model fixed | Clear data direction |
| Motus2 [14] | Stereo ego + limited robot | 2k→20k h gives log-linear loss improvement | Model fixed | Offline fit in range |
| ABC-130K [29] | Low-cost bimanual teleop | 1k→10k h offline error falls; 3.5k→7k pretrain helps fine-tuning; offline–real correlation | DiT-S→xL training loss falls | 10k budget includes internal data; no extrapolation test |
| Genesis GENE-26.5 [30] | Human / glove / robot heterogeneous mix | Claims 200k+ h; open-loop loss, sim zero-shot, and low-data fine-tuning improve with scale | Absolute parameters undisclosed | Company-reported; ticks and fits mostly missing |
| TRI LBM [15] | Robot + Open-X | ≈1.7k h already gives 3–5× new-task data efficiency | Model mostly fixed | Quantitative in range |
| π0.5 + ego [16] | Multi-robot + ego | Human-video gains appear after ≈75% robot diversity | Model fixed | Data complementarity |
| Google RT series [17–19] | Mixed robot embodiments | RT-1 ablates data and capacity; RT-X compares pooled training against original lab methods | No matched cross-generation grid | No RT-X data-slope extrapolation |
| Being-H0 [20] | Human hand video | 0.5M–2.5M samples improve offline hand-motion metrics; no robot success sweep | 8B fixed for the data sweep; separate 1B / 8B / 14B comparison | Offline directional evidence |
What the evidence shows
Hold the model, task, and test still, then feed it broader data: the robot usually gets better. But by how much? At what cost? Does the gain survive a new robot or a new site? The evidence is nowhere near strong enough to say that another 100× of data automatically buys a general-purpose robot.
What “scaling law” originally meant
A scaling law is not the slogan “bigger is better.” It is a relationship fitted from many training runs: as parameter count N, dataset size D, and training compute C grow, how quickly does validation loss L fall?
The constants are not derived from first principles. Teams run smaller experiments, fit the exponents, and use the result to plan an expensive training run before spending the full budget.
“The loss scales as a power-law with model size, dataset size, and the amount of compute used for training.”
OpenAI observed approximate power laws across multiple model, data, and compute scales. If the recipe and distribution remain stable, smaller runs can forecast the loss of a larger one. [25]
“For every doubling of model size the number of training tokens should also be doubled.”
DeepMind re-estimated the allocation using more than 400 training runs. At the same compute budget, 70B-parameter Chinchilla trained on roughly 1.3T tokens beat 280B-parameter Gopher. The lesson was balance, not “small beats large.” [26]
The GPT-4 technical report says final loss was forecast from runs using 1,000–10,000× less compute, with a separate projection for HumanEval. That is the practical value of a scaling law: it does not explain intelligence; it makes a large training run more planable. [27]
With a fixed model and task, adding data will produce some response curve. Calling it a scaling law usually asks for more: a stable relationship, a simple fit, and useful extrapolation to the next scale. Robotics makes all three difficult.
So “some scaling curve must exist” is a weak claim. “We have found a predictable law that extrapolates” is a much stronger one. Most robotics companies have shown the former; only a few are beginning to approach the latter.
Before the long version
Action error is easy to make smooth. Real robots are messier: success jumps around, saturates, and changes with the scoring rules. That messier number is usually the one that matters.
A new object, room, contact pattern, or recovery can be worth more than another thousand demonstrations on the same table.
Use cheap human video to replace some expensive robot hours. Dyna, Figure, EgoScale, Isaac, and Motus2 simply take different routes to the same bet.
A million target-robot teleop hours is brutal. A million people each filming one hour is a completely different operation.
Evidence map
The work falls into four buckets. A is the hard stuff: clean controls, numbered axes, and enough robot trials to say something. B has a real sweep but leaves an important number out. C is mostly directional. D is supporting evidence, not a law. This grades the scaling claim—not the model.
| Date / team | What changed | Largest disclosed scale | Outcome measured | Grade |
|---|
Units are preserved. Episodes, trajectories, robot hours, and video hours are not force-converted into a single denominator.
Curve atlas
Every chart is redrawn from company- or paper-disclosed figures. The y-axes and evaluation protocols differ, so slopes must not be compared directly. What matters here is the shape and strength of the evidence.
Case files
This is the widest—and cleanest-controlled—public curve: 1k, 10k, 100k, and one million hours.
Dyna uses nested datasets, so each larger run adds data instead of quietly changing the mix. Four offline metrics improve all the way up, and 39 robot tasks absent from pretraining keep the same ordering. Add at most ten robot hours per task and the 14-task average moves 20→28→45→53.
For deployment-minded readers, Rhoda is the best place to start. It does not shout the loudest; it shows the work.
On a customer's bearing-unpacking task, XS/S/M/L reach 3.7/65.0/75.3/84.7% complete-at-speed. Holding the M model fixed, 0.08×→1× pretraining compute yields 57.8→67.3→74.5→75.3%. The study uses more than 200 hours of robot evaluation and 100–260 trials per policy, except an obviously poor XS run stopped at 27.
Sunday asks the practical question: can a fix made in the lab survive somebody else's house?
With identical post-training, 0/12/25/50/100% pretraining produces out-of-domain laundry success of 14/90/92/96/100%, shrinking the in-vs-out gap from 82 points to zero. In a separate 12.5/25/50% sweep, quality-selected data achieves 75.6/87.9/92.3%; uniform subsets achieve only 43.8/53.6/64.1%.
Among the “teach a dexterous hand from human video” projects, EgoScale reads most like a conventional paper.
20,854 hours of action-labeled first-person video raises task completion from 0.30 at 1k hours to 0.71 at 20k. The paper gives an explicit fit, L=0.024−0.003·ln(D), and the final policy beats no pretraining by 54% on average.
The same world-action model is trained from scratch on 300 / 1,200 / 5,000 / 30,000 hours, then tested zero-shot on 100 tasks.
On G1-OP, tasks with non-zero success rise from 39 to 76 and overall success from 17.1 to 44.1%. G2-90D represents less than 2% of the training mix yet improves from 13.4 to 31.1%, suggesting cross-embodiment transfer. The data also includes 2,000 hours of failures and deployment rollouts.
TRI does not have the biggest dataset. It does have 1,800 real rollouts and more than 47,000 simulated ones.
Fine-tuned performance improves smoothly as more pretraining tasks enter the mix, and new tasks need 3–5× less data to reach the same level. The team explicitly reports no discontinuity or sudden emergence; without fine-tuning, the multitask policy does not consistently beat a from-scratch specialist.
The 2025 10–60 hour logistics result is a single-task learning curve: 6.34→4.31 seconds per package and 88.2→94.4% barcode success. Helix 2.5 is the foundation-pretraining sweep: 1×→8× Index data lowers robot-action loss by about 3.7%; with vs. without Index pretraining, full-task success in unseen homes is 56% vs. 9%. But Index's absolute training hours are hidden, and the four loss points are not paired with four real-robot success points.
GEN-0 includes internal multi-scale pretraining experiments. GEN-1 was trained from scratch on a pool above 500k hours with changes to its training and system design. GEN-1.5 began in parallel and ran continuously for more than eight months. These releases answer different questions: GEN-0 has a readable local sweep, GEN-1's task comparison is not a data-only ablation, and GEN-1.5's time series is not a data-only scaling curve.
A matched 1k→100k hour study compares video-demonstration prompting with a language VLA. On unseen long-horizon tasks at 100k hours, ICL reaches 66% versus 9% for the VLA; on seen tasks ICL reaches 96%. But the metric is cumulative step success with human recovery after failures, and the absolute composition of the data mix is undisclosed. It is not equivalent to unattended end-to-end completion.
Seven video budgets from 1k to 1M hours are crossed with 2–10k hours of teleoperation. On the held-out action-loss=2.50 contour, required teleoperation falls from 5,884 to 28 hours. This is the clearest published price-exchange curve between cheap video and costly robot data, but the 210× number depends on one chosen loss threshold and lacks equivalent real-robot validation.
The final pool exceeds 100k UMI hours, but the controlled scaling sweep is limited to a 20k-hour subset: 26% without action pretraining; approximately 2.5k, 5k, 10k, and 20k hours yield 53%, 56%, 69%, and 75%. With the same 20k hours, 2B/5B/10B models score 61/75/79%. Data appears to be the present bottleneck, but the headline pool and experimental sweep must be kept separate.
3k / 6k / 13k / 18k / 20k hours of real dual-arm robot data across nine embodiments produce continued downstream gains with no saturation. Code, weights, and the GM-100 benchmark are public. Version 2.0 later grows to 60k hours—50k robot plus 10k ego—but that release is more a generational comparison than a clean single-variable law.
A 130k-hour raw human-video pyramid feeds the system, but the actual stereo scaling sweep is 2k/4k/10k/20k hours with L=0.101−0.005·ln(D), followed by 100+ robot hours for alignment. It usefully distinguishes a headline raw pool from the data that actually belongs to one curve.
Robot-pretraining diversity is increased through 0/25/50/75/100% and then a cross-embodiment full mix. The gain from human video appears only after roughly 75% and nearly doubles average performance over four generalization tasks. This is better read as scale enabling a new data source than as an hours-based power law.
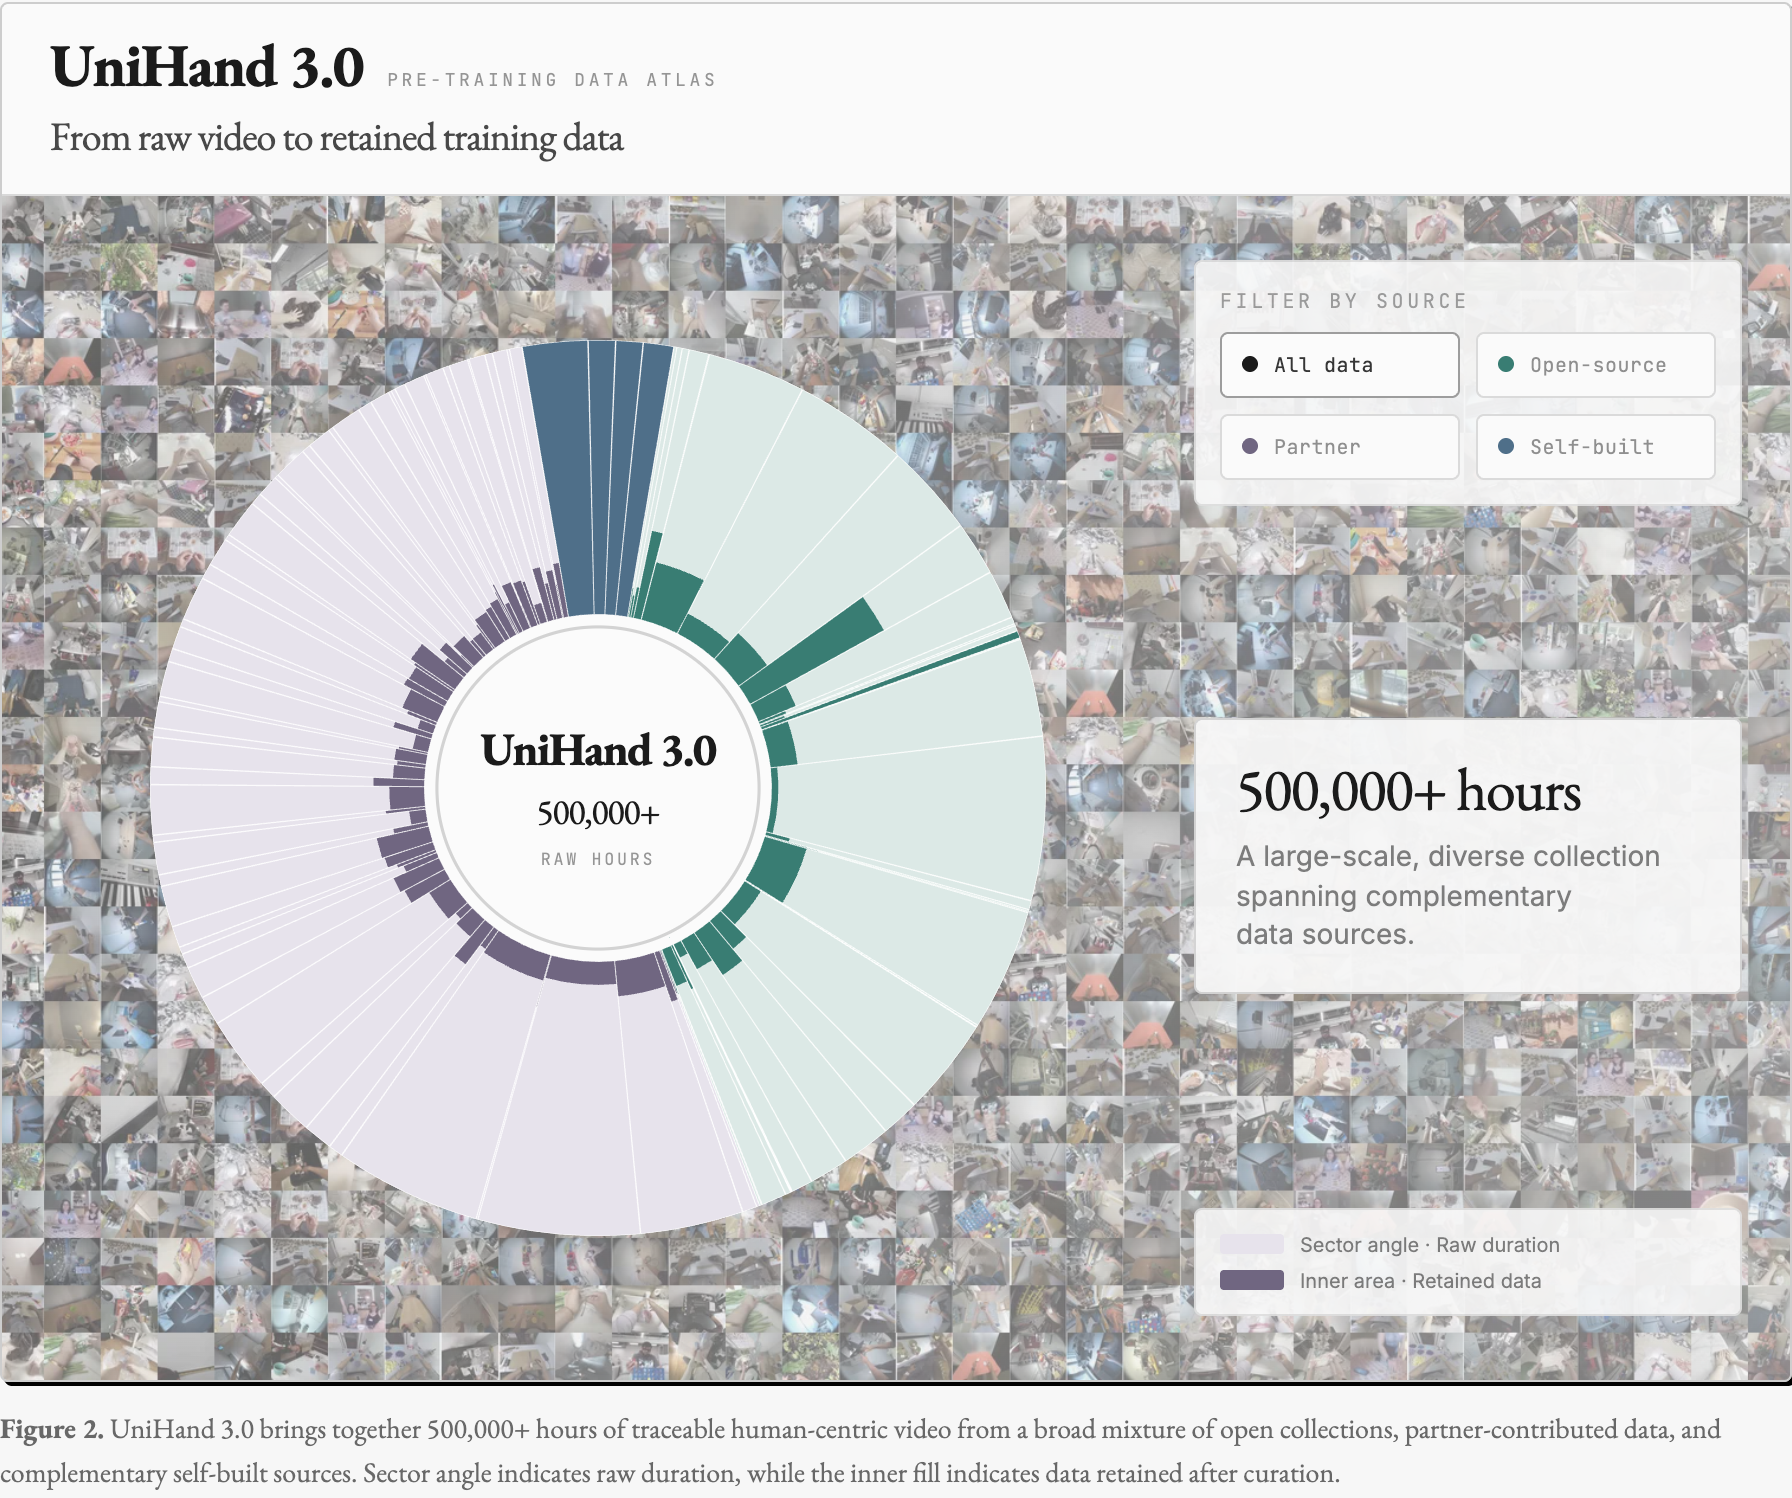
Being-H0's ICML paper shows hand-motion generation improving with both model and data scale. H0.8 expands the raw egocentric-human-video pool beyond 500k hours and adds inferred tactile supervision. It demonstrates that the data infrastructure can become very large, but public materials do not split the 500k pool into a matched real-robot success sweep. “At scale” is not automatically a scaling law.
RT-1 ablates data volume, diversity, and capacity within its task family. RT-X pools trajectories from 22 embodiments but compares the mixed model with original methods at partner labs rather than sweeping dataset size. On-Device 2 separately varies adaptation hours on new embodiments. These do not form one cross-generation scaling curve.
Before comparing totals
Occupies a robot, operator, and site. Provides actions and proprioception with the smallest embodiment gap. Core to LingBot and TRI.
Avoids tying up the target robot while retaining hand or gripper trajectories. Central to Sunday, Xiaomi, and Figure Index.
Crowdsourcable to a million hours; actions come from hand tracking or pseudo-labels. Used by Dyna, EgoScale, Generalist, and Motus2.
Effectively unlimited scale, but no actions or control state. Rhoda and Isaac test whether visual world knowledge becomes a useful control prior.
Disclosed data scale
The x-axis only locates the size of disclosed data pools. The public pool, the subset actually used for training, and the deduplicated effective sample should be reported separately. Robot teleoperation, human video, UMI capture, and general video also differ substantially in cost, action supervision, and information density.
Resource estimate
Even if we could fit a loss curve for one setting, two questions would remain: what would the next reduction in loss cost, and how much more work would the robot actually do? Public disclosures do not yet let us calculate both. The calculator below puts one million hours of collection in perspective. Its default $250 per hour is an adjustable scenario, not an industry average or any company's actual cost. It excludes training compute and does not fully account for hardware depreciation, field operations, or multi-platform integration.
That is 114 continuous years, or roughly 170 sixteen-hour waking years. Human video can be parallelized across thousands of people; target-robot teleoperation at this scale is prohibitive for most teams.
Thirty-five minutes per second is 5.75 continuous human-years per day—one million uploaded hours in about 20 days. Filtering and quality control reduce the resulting trainable volume.
At 30 productive hours per collector per week, the pipeline needs roughly 333 active collectors. People carry most of the collection load, allowing the robot count to remain lower.
That is 11.4 continuous robot-years, or about 67 devices collecting six hours per working day for a year. Integrating 35+ systems adds a substantial hidden cost.
For one task: if new data repeats the same settings, objects, and actions, its marginal value may fall quickly. Figure Logistics' barcode rate dips slightly from 10 to 20 hours; Rhoda's final two robot-success ranges overlap when downstream data is plentiful. These are local cautions, not a general hour limit.
For a foundation model: some well-funded, operationally mature teams may be able to support 20k–100k hours from UMI rigs, gloves, or human video. Making all of that target-robot teleoperation raises capital, hardware, and field-operations requirements substantially.
At one million: human video can be parallelized across many collectors. A million hours of target-robot data becomes more plausible when a commercial fleet is already deployed. The test is whether cheaper data's loss improvement crosses the human-to-robot embodiment gap and translates into robot-task gains.
Push the curves into the real world
The moat will not be one more backbone swap. It will be the plumbing: collecting genuinely new situations, rejecting junk, and getting failures from customer sites back into training quickly.
Dyna and Figure treat the human–robot gap as something scale can close. Sunday goes further by co-designing its capture glove and Memo's hand. Humanoid form may be a data-interface strategy as much as an environmental one.
If pretraining really cuts a new task from hundreds of hours to one hour—or one demonstration—robot deployment can finally look like a product instead of bespoke ML consulting. That matters more than two extra benchmark points.
The precision literature finds the opposite law: demonstrations grow super-exponentially near a system's precision limit. Adding a wrist camera moves the limit from 3.85mm to 2.35mm; a clearer expert strategy moves it to 1.27mm. Better sensing and control may beat 10× more data.
Sunday's selected 12.5% beats a uniform 50%. Academic studies likewise find environment and object diversity more important than repetitions per setting. Coverage and marginal data value should replace raw hours as headline metrics.
Do not let a clean line do the thinking
What the evidence shows
Taken together, the curves do not support “a billion hours and AGI appears.” They do support three simpler claims:
First, when new data actually adds coverage, robots usually keep getting better. Across today's published 20k–1M human-video and 20k–30k robot/UMI ranges, the effect has not broadly hit a wall.
Second, returns are wildly task-dependent. Some rise smoothly, some cross a threshold, and others stay pinned by sensing or precision limits.
Third, the sane route is not endless target-robot demonstrations. Build the prior with cheap human video and simulation, then spend costly robot hours on grounding, failures, and precision.
What stronger evidence would look like
If a company says it has found a robot scaling law, I would first want to see a defined data interface and a fixed held-out evaluation distribution. With the model and training recipe controlled, how does loss change as data or compute grows? Was the largest run reserved before training to test the forecast, and how large was the error? Without that evidence, a few rising success rates are better described as a useful learning curve.
Only then comes the second question: how many more tasks do the same checkpoints complete at unfamiliar sites, and what changes in task time, recovery, and human intervention? Test new environments, new tasks, and new embodiments separately, with trial counts and uncertainty. That would show whether lower loss accompanies real-robot gains. Today, loss and robot outcomes often come from different experiments, so the relationship between them remains unestablished.
Finally, add up the costs of new data, robot collection, training compute, and deployment. Effective coverage—new objects, settings, contact states, failure modes, and recovery paths—may matter more than raw hours. But which data source is worth the next investment still needs a controlled comparison.
Robotics may still be far from its GPT moment—or from demonstrating a reliable scaling law. Perhaps its defining breakthrough will be an iPhone moment: bringing hardware, software, and intelligence together into a product that works reliably in the real world.
Supplement · evidence archive
This appendix does not repeat project conclusions. It provides the row-by-row basis for the 19→16→13→1→0 summary above. Sixteen projects enter the main scaling-curve collection; π0.5 + ego, RT-X, and Being remain indirect evidence.
Clear controls and axes, with substantial offline or robot tests, uncertainty, or reproducible results.
A real multi-scale sweep with one key quantity, full robot curve, or uncertainty report missing.
A visible trend, but model, data, algorithm, or system generation changes together.
Related work measures components, data, or transfer effects, but does not directly test how real-robot manipulation changes with policy scale.
✓ meets the criterion and counts in the numerator; △ indicates related evidence with a missing control or link; — means no public evidence found. A complete loop forecasts held-out loss and then validates robot outcomes on the same model family.
| Project | Multi-scale curve 16/19 | Main variables controlled 13/19 | Held-out-scale test 1/19 | Forecast→robot loop 0/19 | Source |
|---|---|---|---|---|---|
| Generalist | ✓ | ✓ | △Extrapolated, not held out | △Offline and robot results do not form a forecast chain | [9][10][28] |
| Figure Helix 2.5 | ✓ | ✓ | ✓ | △Robot result comes from another experiment | [6] |
| Xiaomi-Robotics-1 | ✓ | ✓ | — | — | [7] |
| Dyna-2 | ✓ | ✓ | — | △Matched scales, no held-out forecast | [1] |
| Rhoda | ✓ | ✓ | — | — | [2] |
| Sunday ACT-2 | ✓ | ✓ | — | △Reports a loss–success correlation | [3] |
| Figure Logistics | ✓ | ✓ | — | — | [4] |
| Isaac 0.5 | ✓ | ✓ | — | — | [8] |
| AGIBOT GE-Act 2.0 | ✓ | ✓ | — | — | [5] |
| Skild S1 | ✓ | △Metric includes human resets | — | — | [11] |
| ABC-130K | ✓ | ✓ | — | △Offline–robot correlation, no held-out forecast | [29] |
| Genesis GENE-26.5 | ✓ | △Model, data, and compute vary | — | △Three experiments use different y-axes | [30] |
| EgoScale | ✓ | ✓ | — | △Matched scales, no held-out forecast | [12] |
| LingBot-VLA | ✓ | ✓ | — | — | [13] |
| Motus2 | ✓ | ✓ | — | — | [14] |
| TRI LBM | ✓ | △Tasks and data mixture change together | — | — | [15] |
| π0.5 + egoIndirect | —Data-recipe comparison | △Human-video scale is not swept | — | — | [16] |
| RT-XIndirect | —Method comparison | △Protocols differ across labs | — | — | [18] |
| Being-H0 / H0.8Indirect | △Offline hand-motion curve | △Not a robot-policy evaluation | — | — | [20][21] |
These results inform data complementarity, cross-embodiment transfer, and human-motion data, but do not establish a multi-scale robot-manipulation policy curve on one target distribution. They therefore stay outside the 16 main curves.
The chart varies robot-pretraining diversity and measures the added gain from a fixed amount of human egocentric video across four transfer tasks. The x-axis is not human-video hours, and the y-axis is not absolute policy performance. It shows complementarity between two data sources, not a scaling slope for human video.
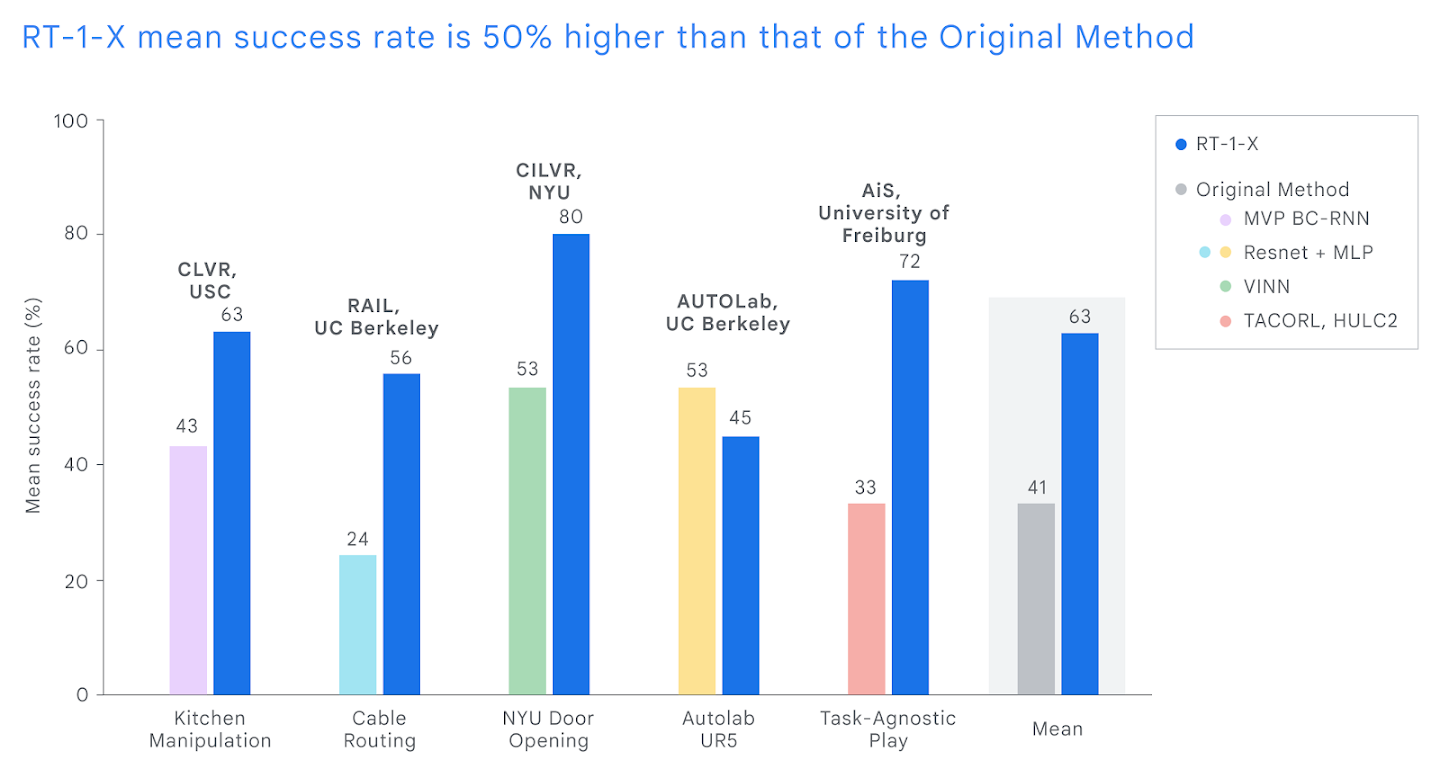
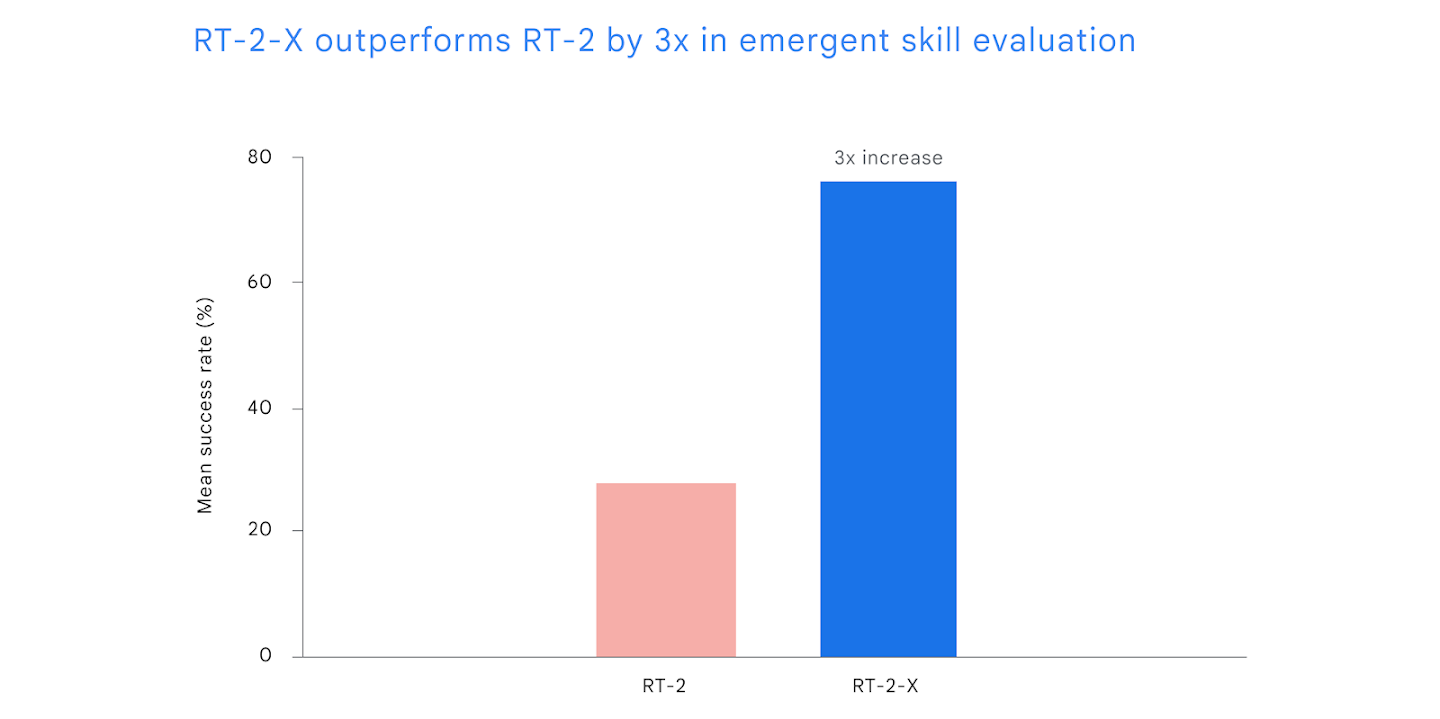
RT-1-X averages 63% success across five labs versus 41% for their original methods; another chart compares RT-2-X and RT-2 on emergent skills. Both x-axes compare methods or settings, not successive data, model, or compute scales.
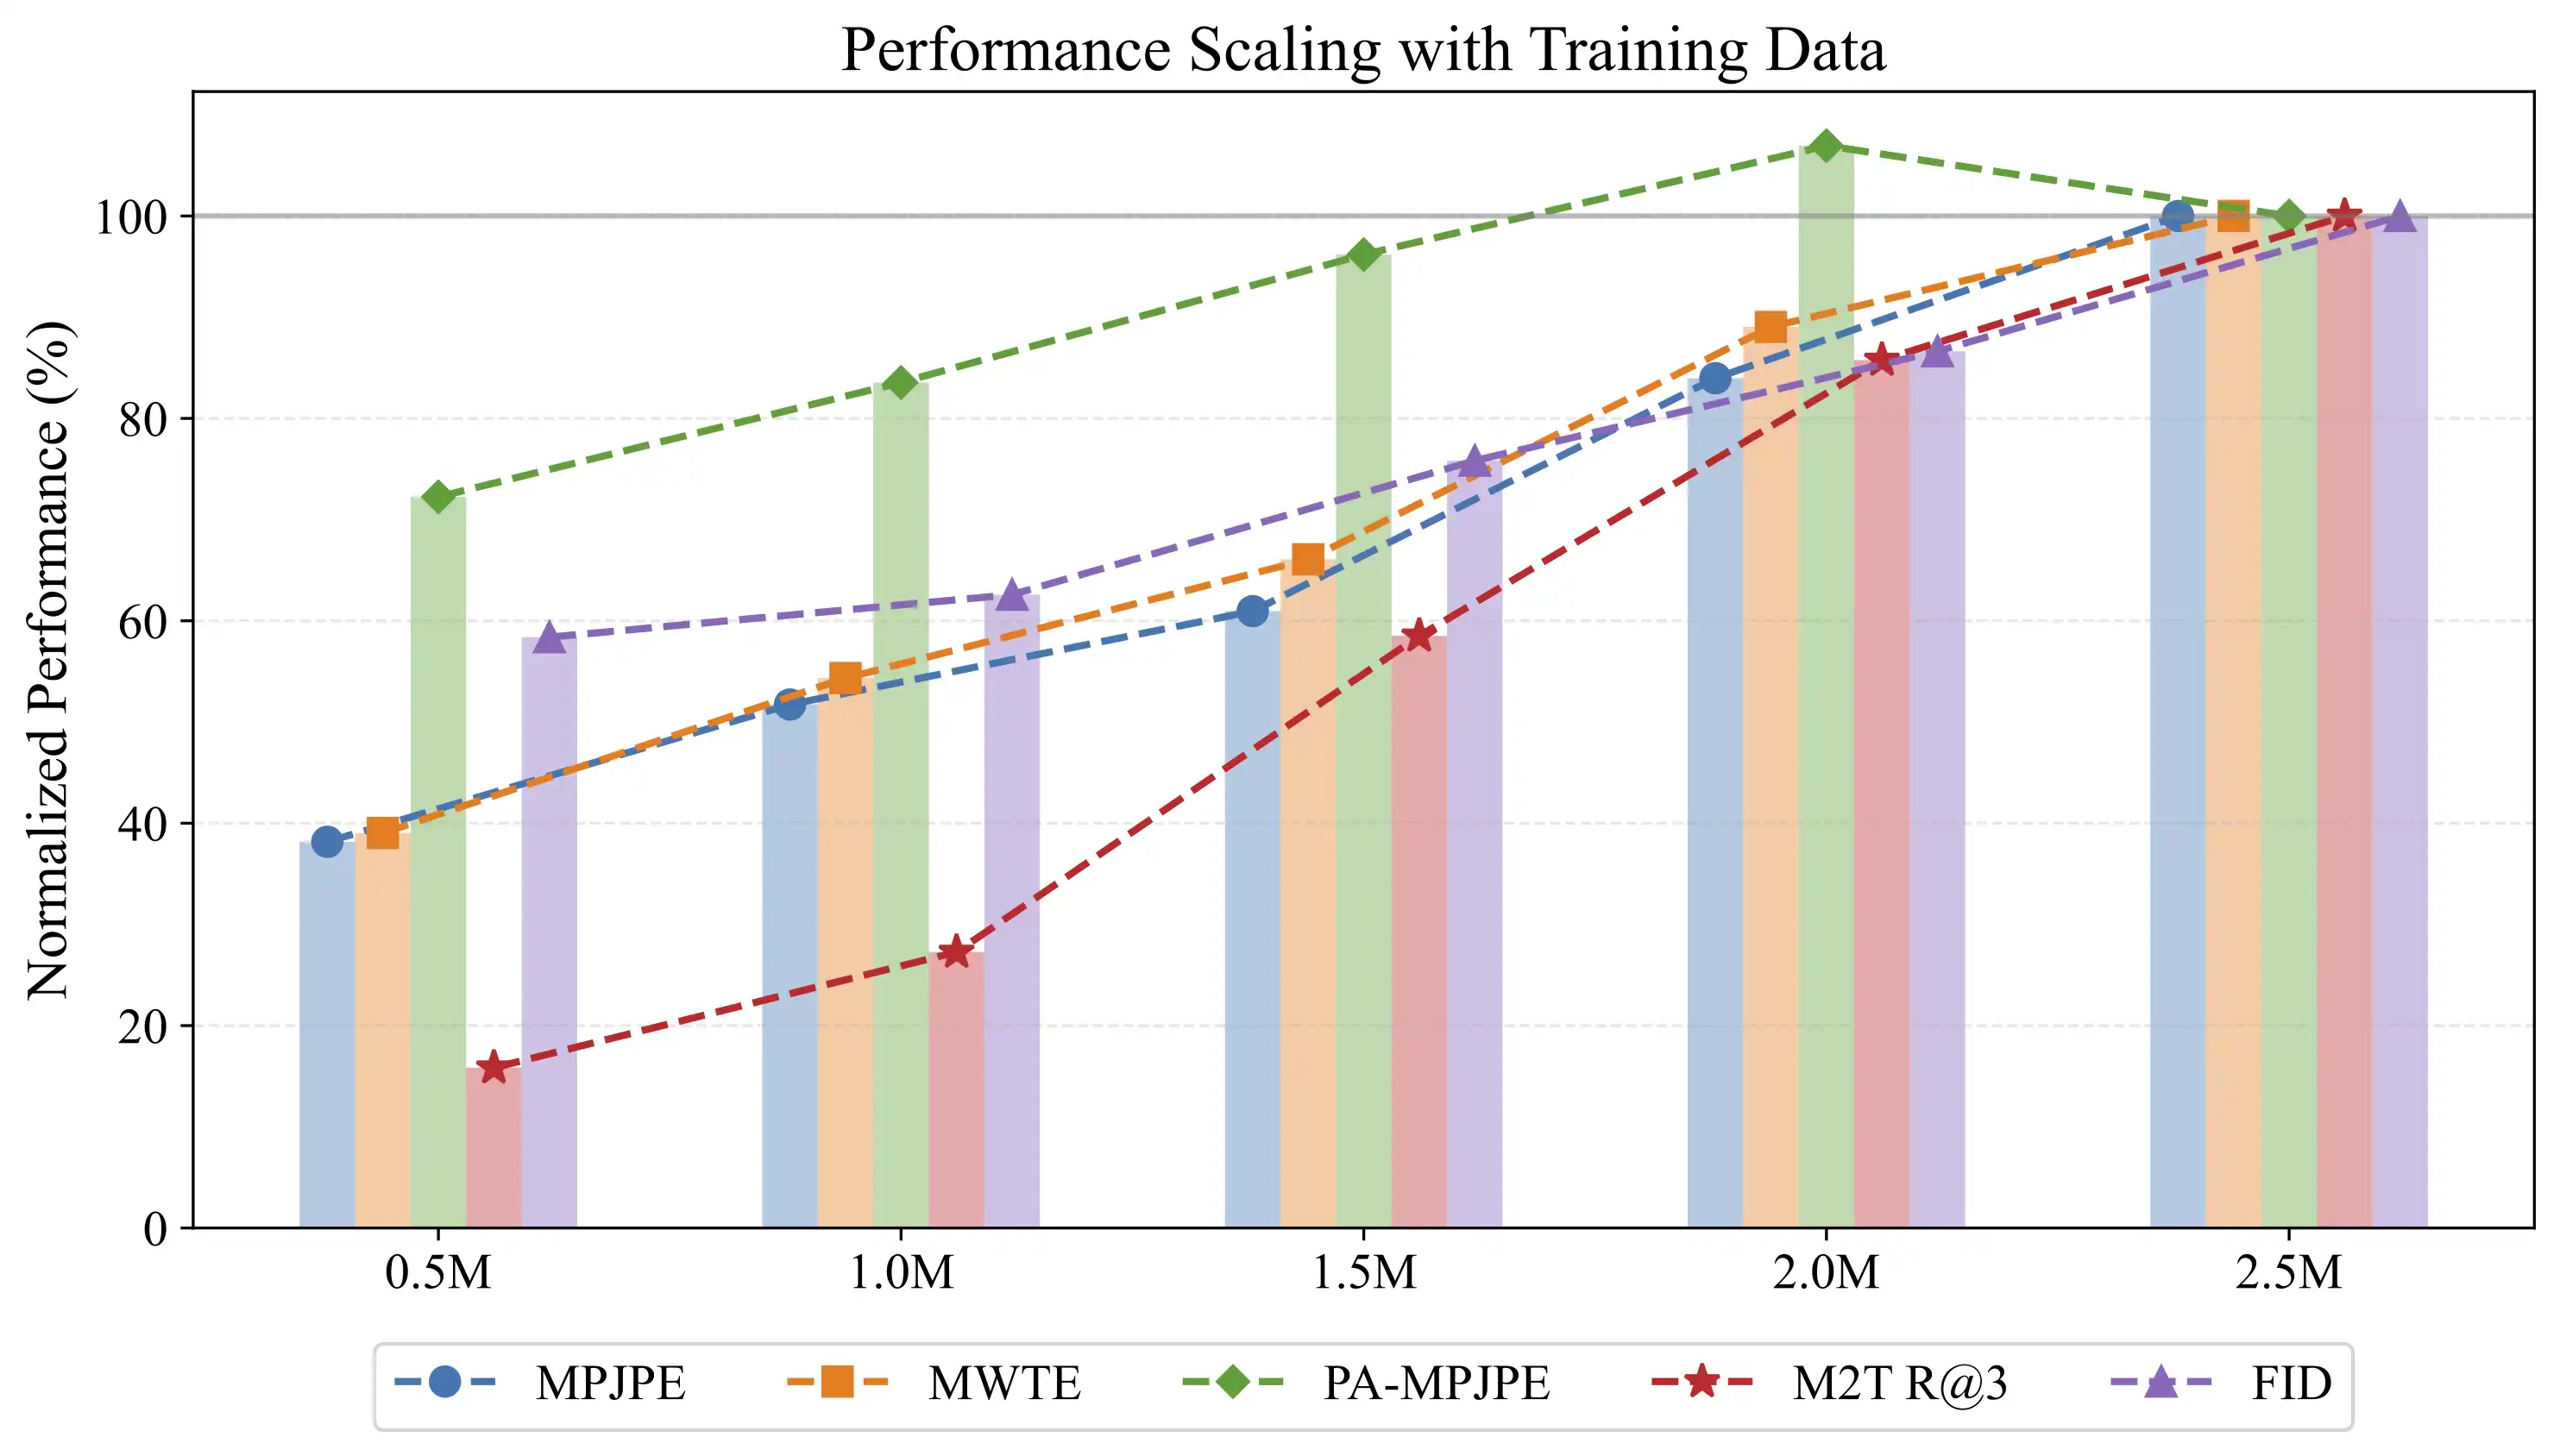
Being-H0 holds its 8B model fixed and tests offline hand-motion metrics across 0.5M–2.5M motion–instruction samples; this is not full-task robot success. H0.8 reports a 500k+-hour raw human-video pool, whose figure maps sources and retained data rather than a training-performance sweep.
| Date / team | What changed | Largest disclosed scale | Outcome measured | Grade |
|---|
The widest public nested-data curve runs from 1k to 1M video hours; mean normalized performance over 14 robot tasks is 20%→28%→45%→53%. The final 900k hours move the metric from 45% to 53%, an eight-percentage-point gain, with 10–12 robot trials per task.
Moving from zero to 12% pretraining takes out-of-domain laundry success from 14% to 90%; later gains flatten. A quality-selected 12.5% subset also beats a uniformly sampled 50%. Coverage and selection can be worth more than four times the volume.
Holding the model fixed, more pretraining compute yields 57.8→67.3→74.5→75.3% complete success. With ample downstream data, 0.37× and 1× nearly tie; pretraining gains become larger when demonstrations are scarce.
As pretraining tasks grow, new tasks need 3–5× less data to hit the same performance. The experiment reports no discontinuity; hundreds to a couple thousand diverse hours produce steady transfer.
20,854 hours of egocentric human video produce an explicit loss fit and transfer to a dexterous hand; deployment also uses a small aligned human–robot set. The conclusion therefore applies to video pretraining with limited alignment.
At action-loss=2.50, one million video hours reduce required teleoperation from 5,884 hours to 28. The 210× exchange rate is specific to that loss contour and lacks an equally large real-robot confirmation.
Motus2 tests offline error over 2k–20k raw stereo-video hours; Being-H0 tests offline hand-motion metrics over 0.5M–2.5M training samples. H0.8’s 500k hours are a raw corpus figure. Neither offers a matched multi-scale real-robot success curve.
The benefit from human video appears after robot-pretraining diversity reaches roughly 75%. The result suggests that cheap human data depends on a sufficiently broad robot foundation.
From 300 to 30k hours across 100 atomic tasks and two embodiments, zero-shot success rises at each measured scale. The project page reports all four suite scores and ten trials per task, embodiment, and scale; an out-of-range forecast and aggregate error bars remain absent.
LingBot tests cross-embodiment performance across 3k→20k real-robot hours. RT-X pools a million-plus trajectories from 22 embodiments, but compares mixed training with each lab’s original method. That supports transfer, not a curve against data scale.
At 100k hours, video prompting reaches 66% cumulative step success on unseen long tasks. The metric includes human resets after failure and accumulation of later steps.
The public bimanual teleop pool is about 3.5k hours, with multi-scale data, model, and compute experiments grounded in real-robot evals. The headline finding: validation loss barely predicts real success, while validation action error and training loss do—another reminder that not every “loss” axis is interchangeable.
On a human-centric data path, open-loop loss, large closed-loop simulation, and low-data real fine-tuning all report gains with scale; absolute ticks and fitted forms are not fully disclosed, so read it as a directional company result.
Figure Logistics gives a 10→60-hour object-manipulation learning curve at one site, showing how task time and barcode rate change with data. It does not test transfer to new sites or a general policy-loss law.
References
Research cutoff: 2026-09-18. Company research pages, papers, model cards, and official repositories are preferred. Company self-evaluation still requires independent replication. Original figures are prioritized, with their metrics and evidence limits annotated.
Disclosure: Codex (GPT-6 and GPT-5.6) was deeply involved in the research and writing under close supervision and frequent feedback.
Yutao Sun, Yufei Xue, Bingyi Kang, Qiang Li, Tianyuan Dai, Ziyang Gong, Yunfeng Lin, Zhongxi Chen, Hongze Yu, Zhengbang Zhu